Examples used in this vignette will use the GlobalPatterns dataset from phyloseq.
library(phyloseq)
data(GlobalPatterns)
co_occurrence
This function is an implementation of the pair-wise Spearman rank correlation that you can call in R. The results should be identical. FastCoOccur was originally written by Jin Choi in C++ to be called from the command-line. I rewrote the routine, implementing the Rcpp API, so that it could be called within R, and with a phyloseq-object as the input.
Because of how I implemented the multithreading, there is a large diminishing return to the number of cores used. I found the optimal to be around 4 CPUs, depending on the size of your dataset.
Usage
co_occurrence(phyloseq_obj, treatment = NULL, subset = NULL, rho = 0, p = 0.05, cores = 0)
Arguments
| Call | Description |
|---|---|
phyloseq_obj |
A phyloseq-class object. |
treatment |
Column name as a string, or vector of, in the sample_data. |
p |
The p-value cutoff. All returned co-occurrences will have a p-value less than or equal to p. |
cores |
Number of CPU cores to use for the pair-wise permutations. Default (0) uses max cores available. Parallelization not available for systems running MacOS without openMP |
Examples
filtered_obj <- conglomerate_taxa(GlobalPatterns, "Phylum")
co_occurrence(filtered_obj, "SampleType", rho = 0.8, p = 0.05)
permute_rho
Used to determine a cutoff for which \(\rho\) vlaues are not likely to have occured by random chance. This will create permutations of all combinations of abundances and calculate the pair-wise Spearman rank co-occurence for each. The return will be a distribution of \(\rho\) values that can be used to determing the significance.
The permutation returns a large table of rho-values, so RAM becomes a bottle-neck resource. To deal with this, the results are merged into a single frequency table, which saves an enormous amount of memory. Unfortunately, this doesn’t allow for simple and intuitive multithreading. Because of that, there is a large diminishing return to the number of cores used. I found the optimal to be around 4 CPUs, depending on the size of your dataset.
Usage
permute_rho(phyloseq_obj, treatment, replicate_samples = 'independent', permutations = 100, cores = 0)
Arguments
| Call | Description |
|---|---|
phyloseq_obj |
A phyloseq-class object. |
treatment |
Column name as a string, or vector of, in the sample_data. |
replicate_samples |
Column name as a string or number in the sample_data that indicates which samples are non-independent of each other. |
permutations |
Number of iterations to compute. |
cores |
Number of CPU cores to use for the pair-wise permutations. Default (0) uses max cores available. Parallelization not available for systems running MacOS without openMP configuration. |
Examples
filtered_obj <- conglomerate_taxa(GlobalPatterns, "Phylum")## Warning in conglomerate_taxa(GlobalPatterns, "Phylum"): trees cannot be
## preserved after taxa conglomerationpermute_rho(filtered_obj, "SampleType", replicate_samples = "SampleType", permutations = 5)histogram_permuted_rhos
Creates a ggplot object of the histogram of the rho values by treatment. This is a visualization tool to explain how to find cutoffs, but will also calculate the cutoffs.
Usage
histogram_permuted_rhos(permuted_rhos, p = 0.05, x_breaks = 0.25, colors = 'default')
Arguments
| Call | Description |
|---|---|
permuted_rhos |
A data.table output from permute_rho. |
p |
The significance threshold for setting cutoffs. |
x_breaks |
What intervals to set the ticks on the x-axis. |
colors |
Name of a color set from the RColorBrewer package or a vector palete of R-accepted colors. |
Examples
filtered_obj <- conglomerate_taxa(GlobalPatterns, "Phylum")
permuted_rhos <- permute_rho(filtered_obj, "SampleType", replicate_samples = "SampleType", permutations = 5)
histogram_permuted_rhos(permuted_rhos, p = 0.05)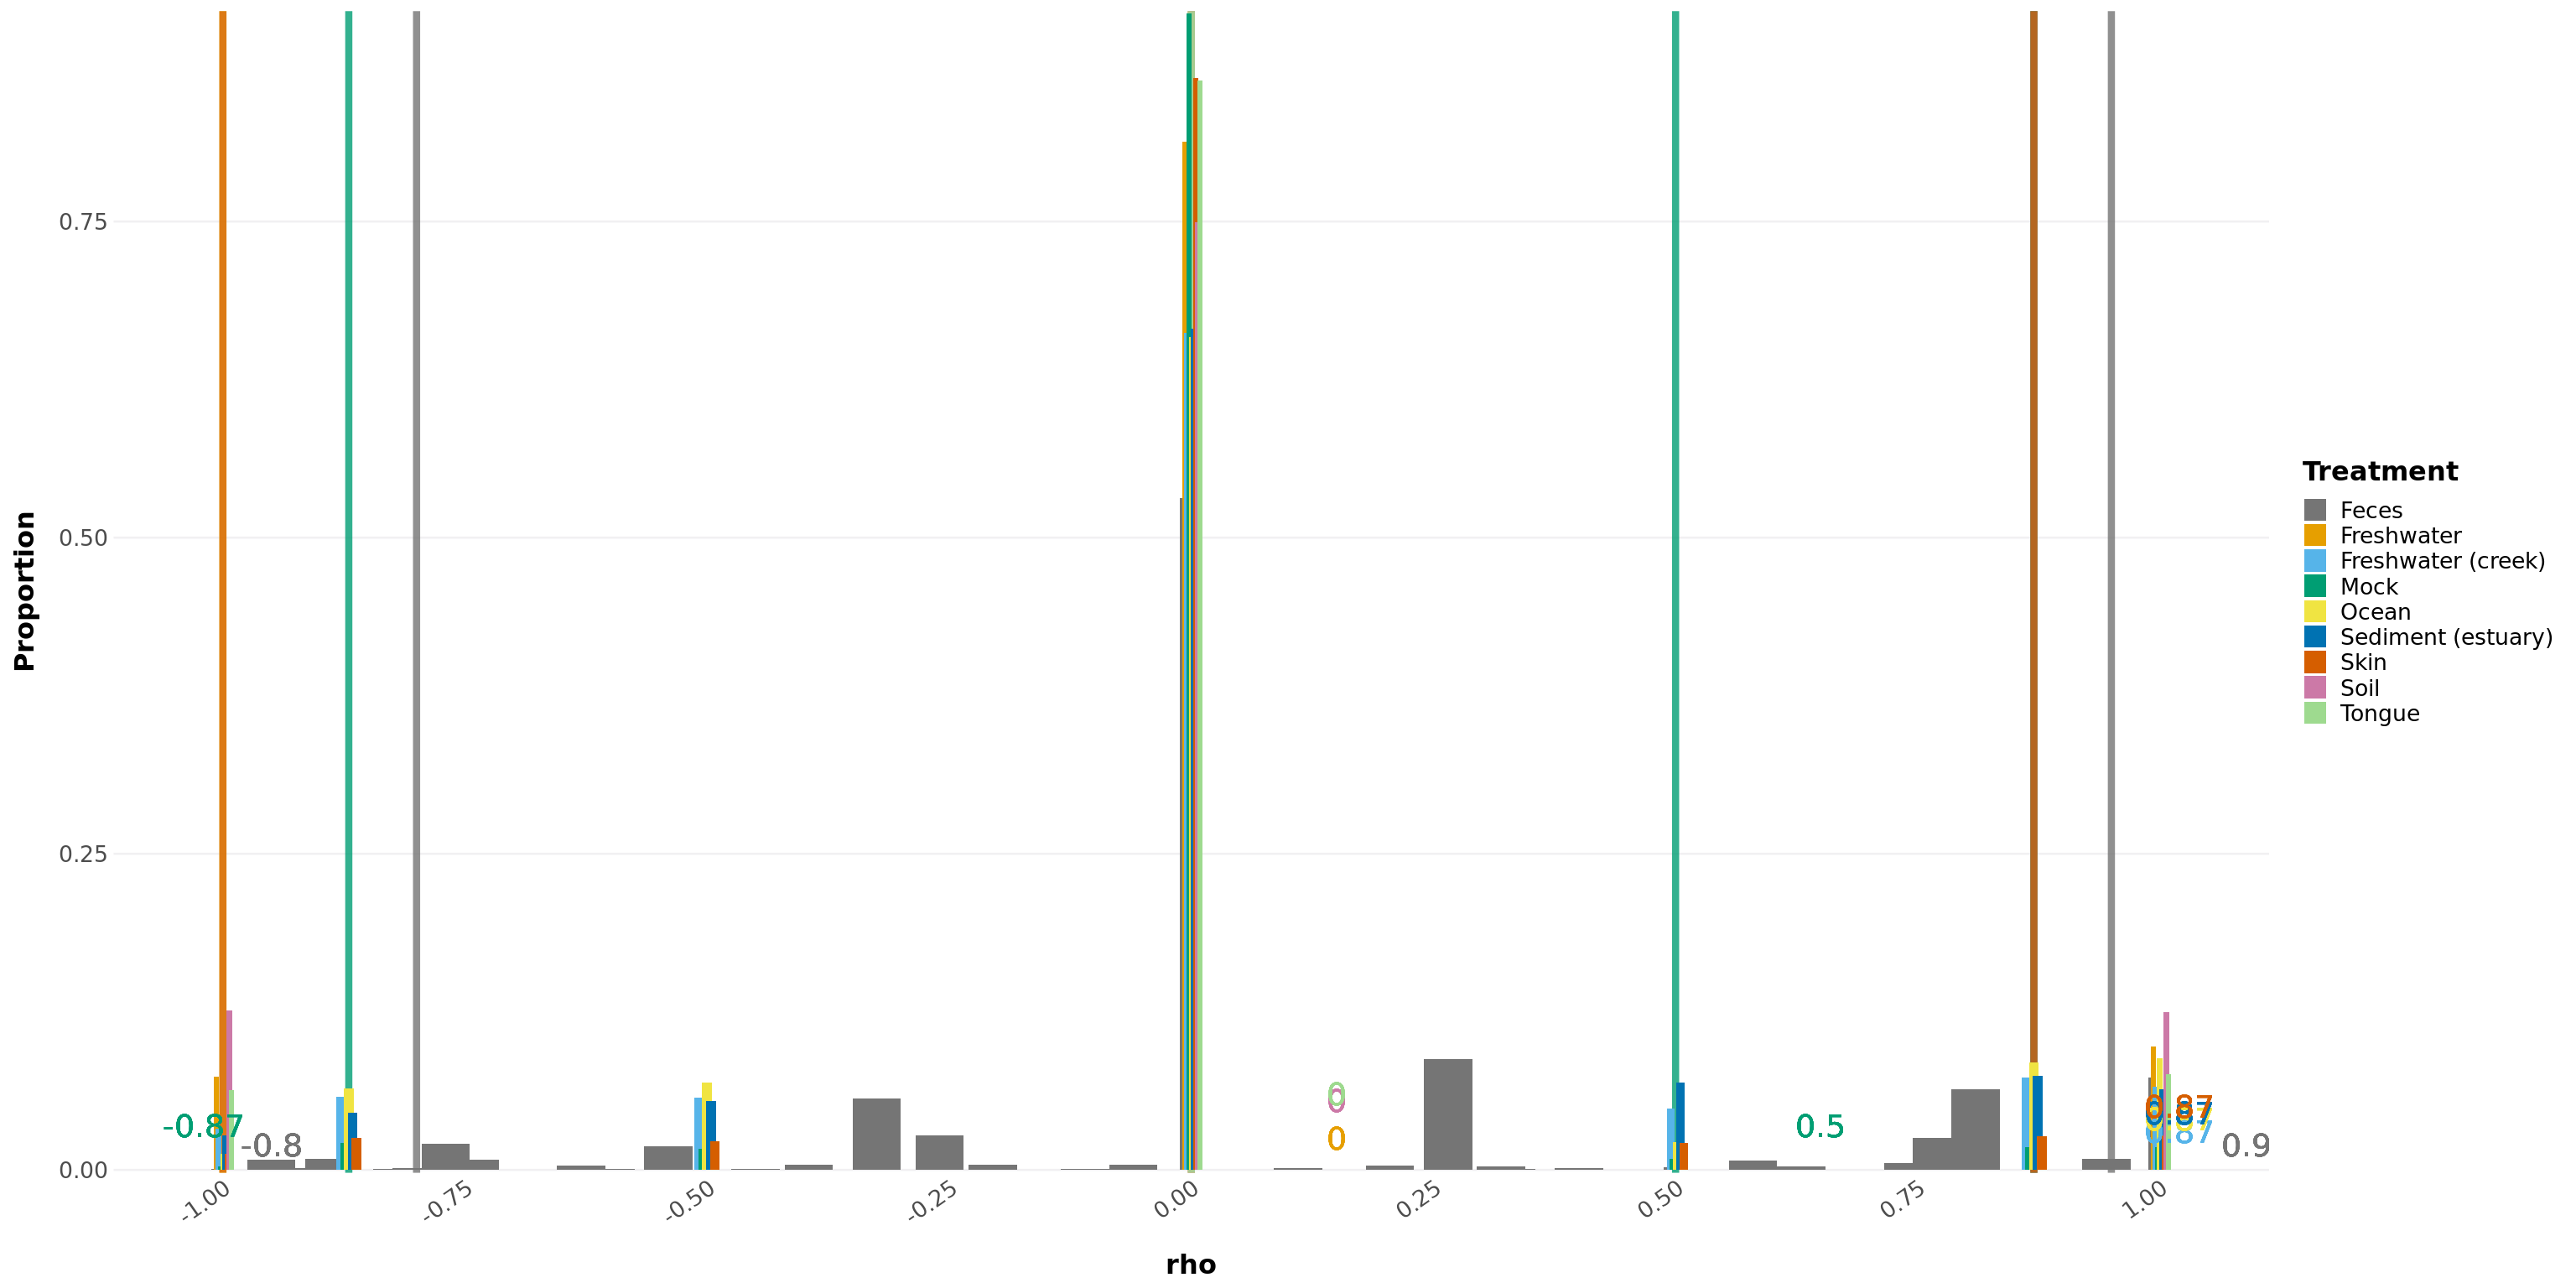
quantile_permuted_rhos
Calculate quantiles for the permuted rho values from the Spearman-rank co-occurrence. Can be done by treatments or for the overall data. This looks at both tails of the distribution, so it will show the p/2 cutoffs on both ends.
Usage
quantile_permuted_rhos(permuted_rhos, p = 0.05, by_treatment = TRUE)
Arguments
| Call | Description |
|---|---|
permuted_rhos |
A data.table output from permute_rho. |
p |
The significance threshold for setting cutoffs. |
by_treatment |
Whether to find the rho cutoffs for each treatment individually or for the entire experiment. Suggested to do by treatment first, to see if there is any treatments that are outliers. |
Examples
filtered_obj <- conglomerate_taxa(GlobalPatterns, "Phylum")
permuted_rhos <- permute_rho(filtered_obj, "SampleType", replicate_samples = "SampleType", permutations = 5)
quantile_permuted_rhos(permuted_rhos, p = 0.05)
quantile_permuted_rhos(permuted_rhos, p = 0.05, by_treatment = FALSE)variable_correlation
Computes the correlation of numerical variables with taxa abundances. Function from the phylosmith-package.
Usage
 variable_correlation(phyloseq_obj, variables, treatment = NULL,subset = NULL,
  classification = NULL, method = 'spearman', cores = 1)
Arguments
| Call | Description |
|---|---|
phyloseq_obj |
A phyloseq-class object. It must contain sample_data with information about each sample, and it must contain tax_table with information about each taxa/gene. |
variables |
Numerical factors within the in the sample_data to correlate with the abundance data. |
treatment |
Column name as a string or numeric in the sample_data. This can be a vector of multiple columns and they will be combined into a new column. |
subset |
A factor within the treatment. This will remove any samples that to not contain this factor. This can be a vector of multiple factors to subset on. |
classification |
Column name as a string or numeric in the tax_table for the factor to conglomerate by. |
method |
Which correlation method to calculate, “pearson”, “spearman”. |
cores numeric value for number of CPU cores to use for the pair-wise permutations. Default (1), 0 uses max cores available. Parallelization not available for systems running MacOS without openMP configuration.
Examples
data(enterotype)
filtered_obj <- phyloseq::subset_samples(enterotype,
  !is.na(enterotype@sam_data$ClinicalStatus))
filtered_obj <- taxa_filter(filtered_obj, frequency = 0.65)

variable_correlation(filtered_obj, variables = "Age",
 treatment = "ClinicalStatus", subset = c("healthy", "elderly", "obese"),
 classification = "Genus", method = "spearman")
Schuyler Smith
Ph.D. Bioinformatics and Computational Biology