Examples used in this vignette will use the GlobalPatterns dataset from phyloseq. Or, in some cases, the enterotype dataset.
library(phyloseq)
data(GlobalPatterns)
Abundance
abundance_heatmap
Create a ggplot object heatmap of abundances of each taxa for each sample.
Usage
abundance_heatmap(phyloseq_obj, classification = NULL, treatment, subset = NULL,
  transformation = 'none', colors = 'default')
Arguments
| Call | Description |
|---|---|
phyloseq_obj |
A phyloseq-class object. |
treatment |
Column name as a string, or vector of, in the sample_data. |
subset |
A factor within the treatment. This will remove any samples that to not contain this factor. This can be a vector of multiple factors to subset on. |
classification |
Column name as a string in the tax_table for the factor |
to conglomerate by. transformation | Transformation to be used on the data. “none”, “relative_abundance”, “log”, “log10”, “log1p”, “log2”, “asn”, “atanh”, “boxcox”, “exp”, “identity”, “logit”, “probability”, “probit”, “reciprocal”, “reverse” and “sqrt”. colors | Name of a color set from the RColorBrewer package or a vector palete of R-accepted colors.
Examples
abundance_heatmap(GlobalPatterns, classification = 'Phylum',
  treatment = "SampleType", transformation = 'log2')
## Warning in conglomerate_taxa(phyloseq_obj, classification, hierarchical =
## FALSE): trees cannot be preserved after taxa conglomeration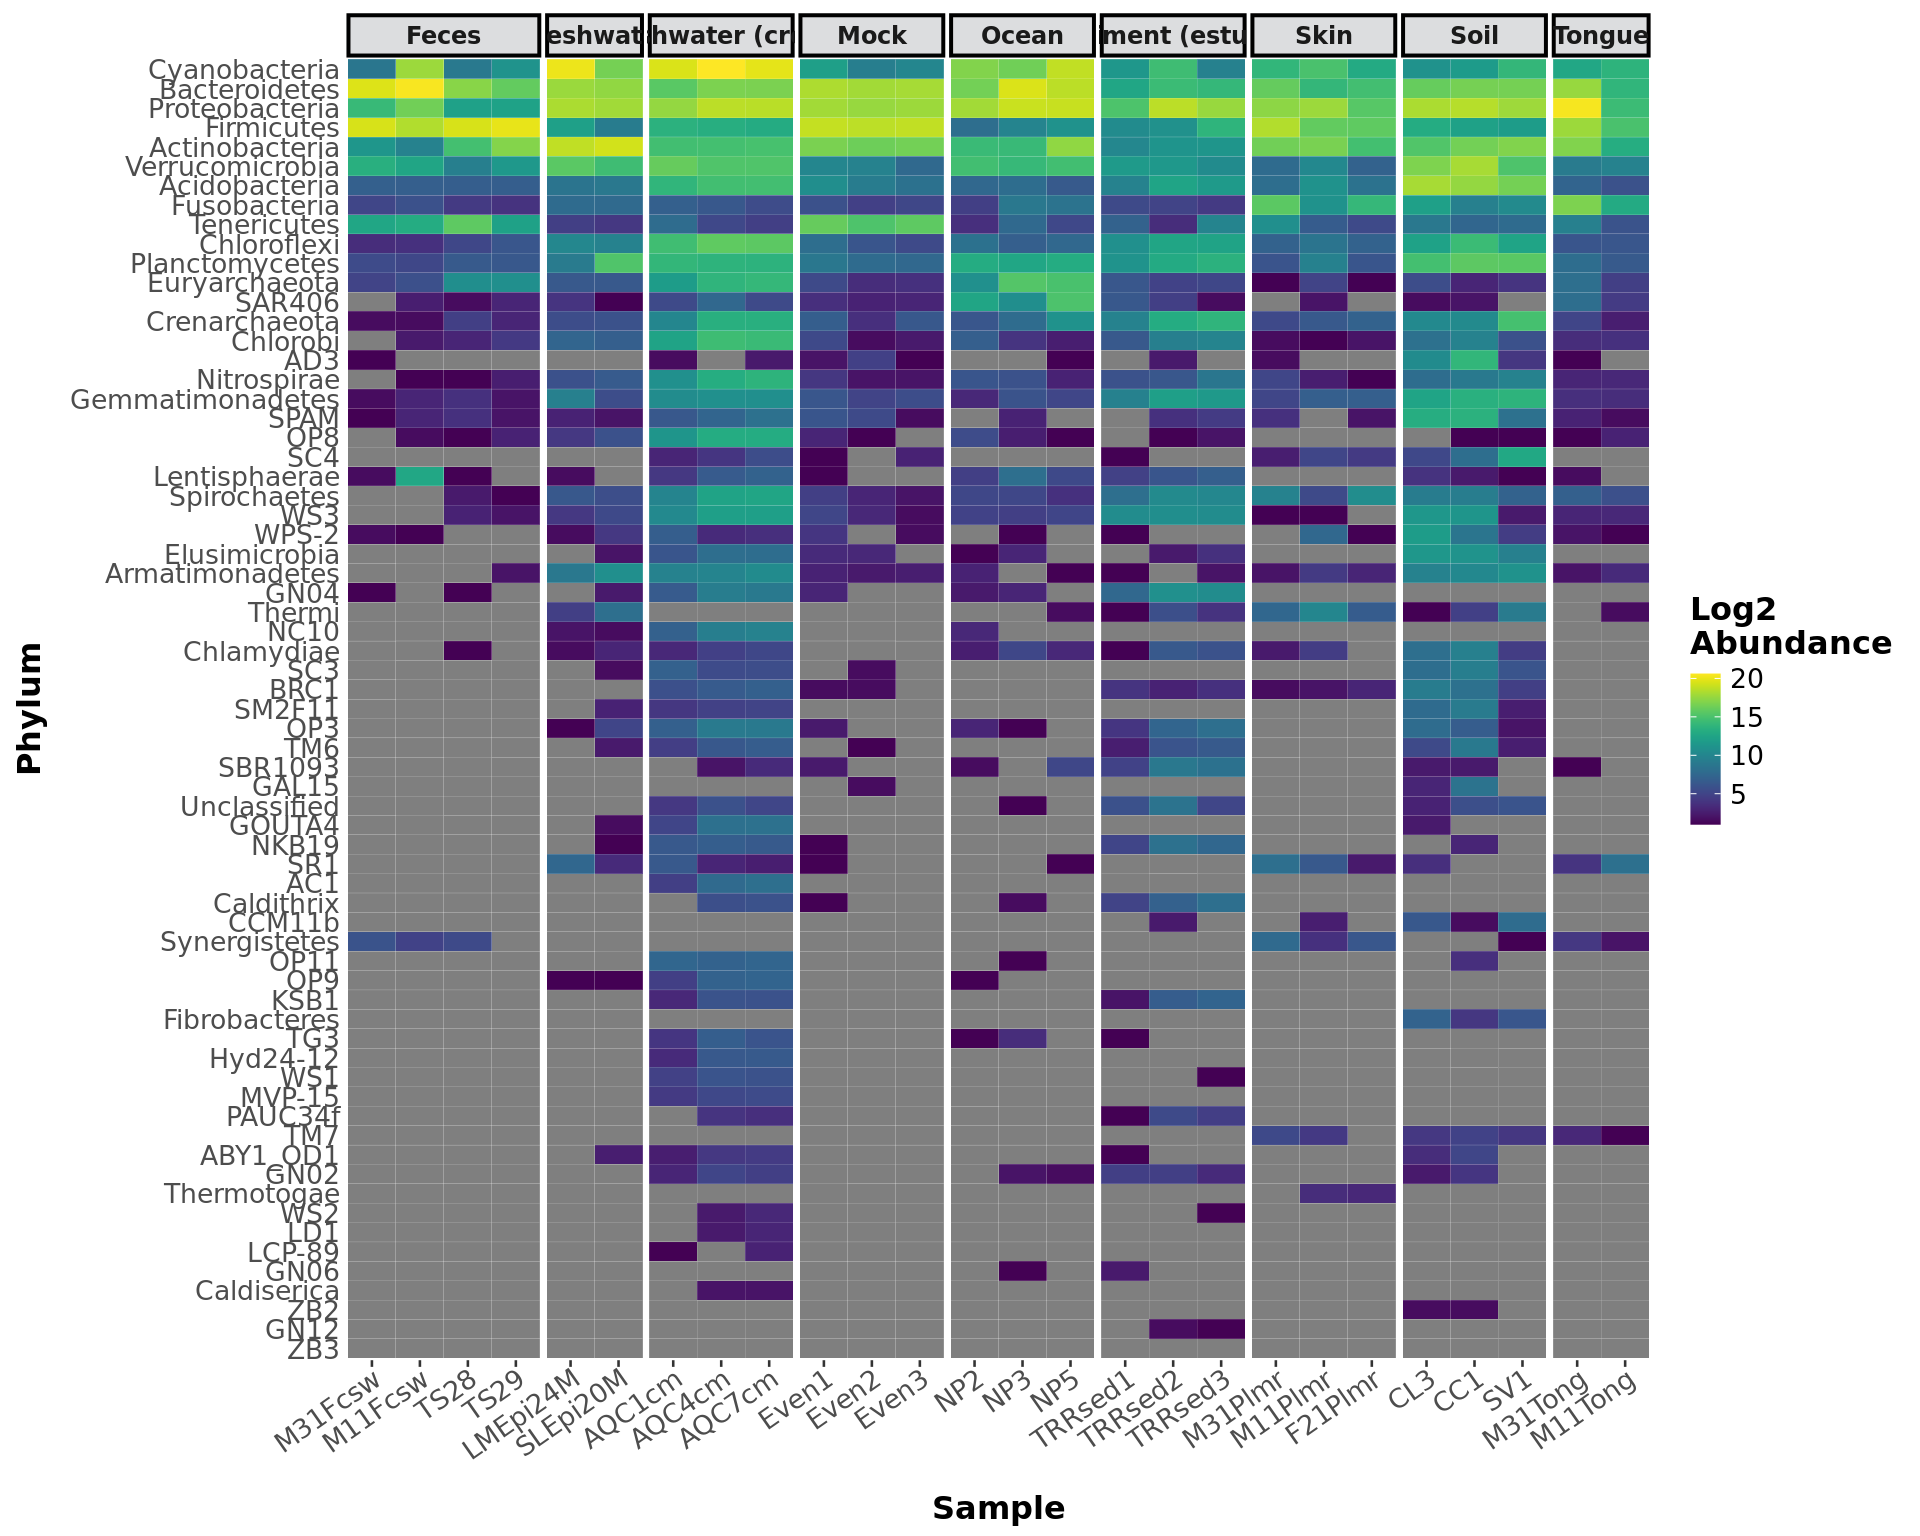
abundance_lines
Create a ggplot object line graph of abundances across samples
Usage
abundance_lines(phyloseq_obj, classification, treatment, subset = NULL,
  relative_abundance = FALSE, points = TRUE, colors = 'default')
Arguments
| Call | Description |
|---|---|
phyloseq_obj |
A phyloseq-class object. |
classification |
Column name as a string in the tax_table for the factor |
to conglomerate by. treatment | Column name as a string, or vector of, in the sample_data. subset | A factor within the treatment. This will remove any samples that to not contain this factor. This can be a vector of multiple factors to subset on. relative_abundance | If TRUE, transforms the abundance data into relative abundance by sample. points | Whether or not to display point on the lines for each data-point. colors | Name of a color set from the RColorBrewer package or a vector palete of R-accepted colors.
Examples
abundance_lines(GlobalPatterns, classification = 'Phylum',
  treatment = "SampleType", subset = c('Soil', 'Mock', 'Skin', 'Ocean'),
  relative_abundance = TRUE)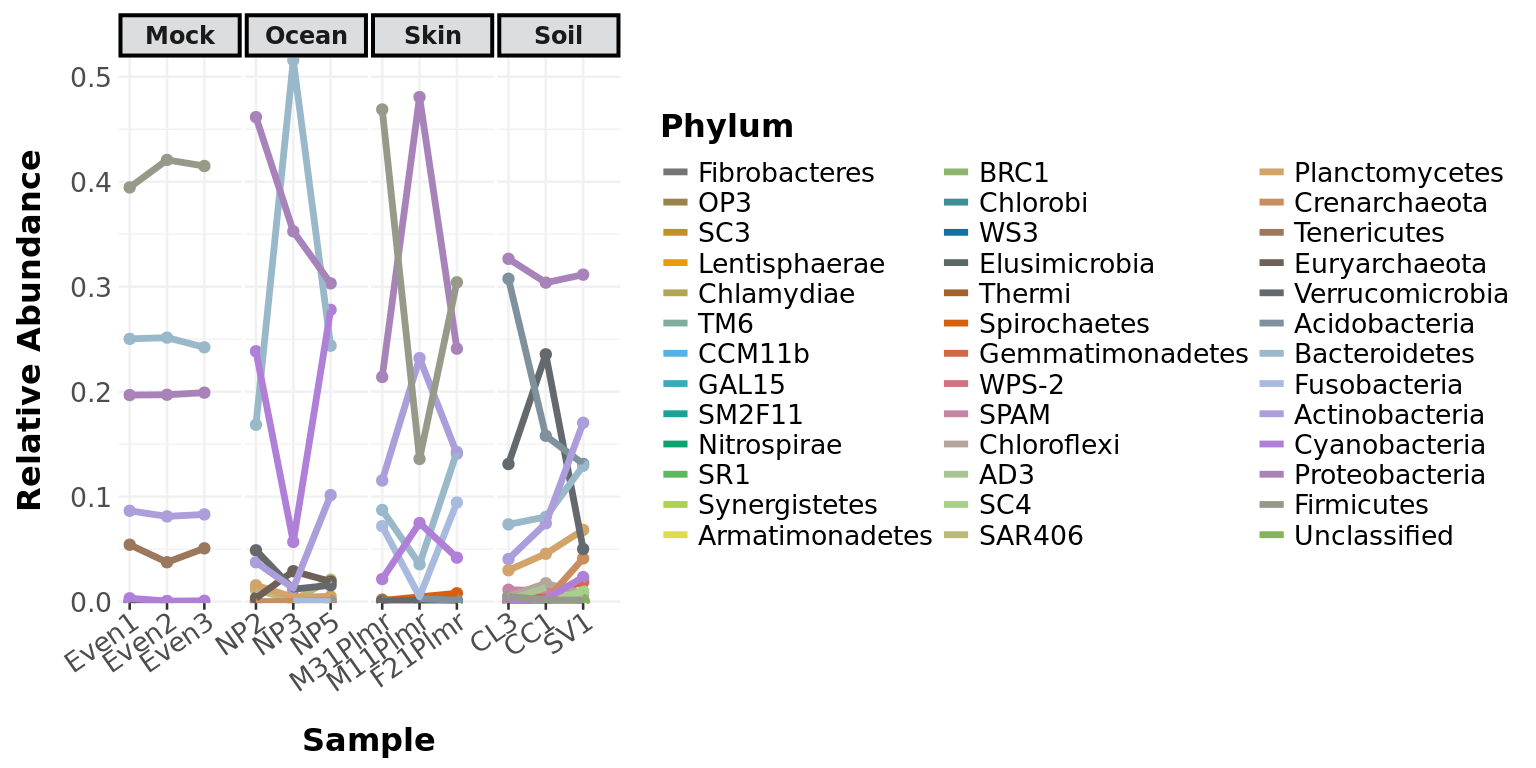
phylogeny_profile
Creates a ggplot object of the stacked bar plots of a classification level in the tax_data, for each sample.
Usage
phylogeny_profile(phyloseq_obj, classification, treatment, subset = NULL,
  merge = TRUE, relative_abundance = FALSE, colors = 'default')
Arguments
| Call | Description |
|---|---|
phyloseq_obj |
A phyloseq-class object. |
classification |
Column name as a string in the tax_table for the factor |
to conglomerate by. treatment | Column name as a string, or vector of, in the sample_data. subset | A factor within the treatment. This will remove any samples that to not contain this factor. This can be a vector of multiple factors to subset on. merge | If FALSE, will show separation of individuals within each classification. relative_abundance | If TRUE, transforms the abundance data into relative abundance by sample. colors | Name of a color set from the RColorBrewer package or a vector palete of R-accepted colors.
Examples
phylogeny_profile(GlobalPatterns, classification = 'Phylum',
  treatment = "SampleType", merge = TRUE,
  relative_abundance = TRUE)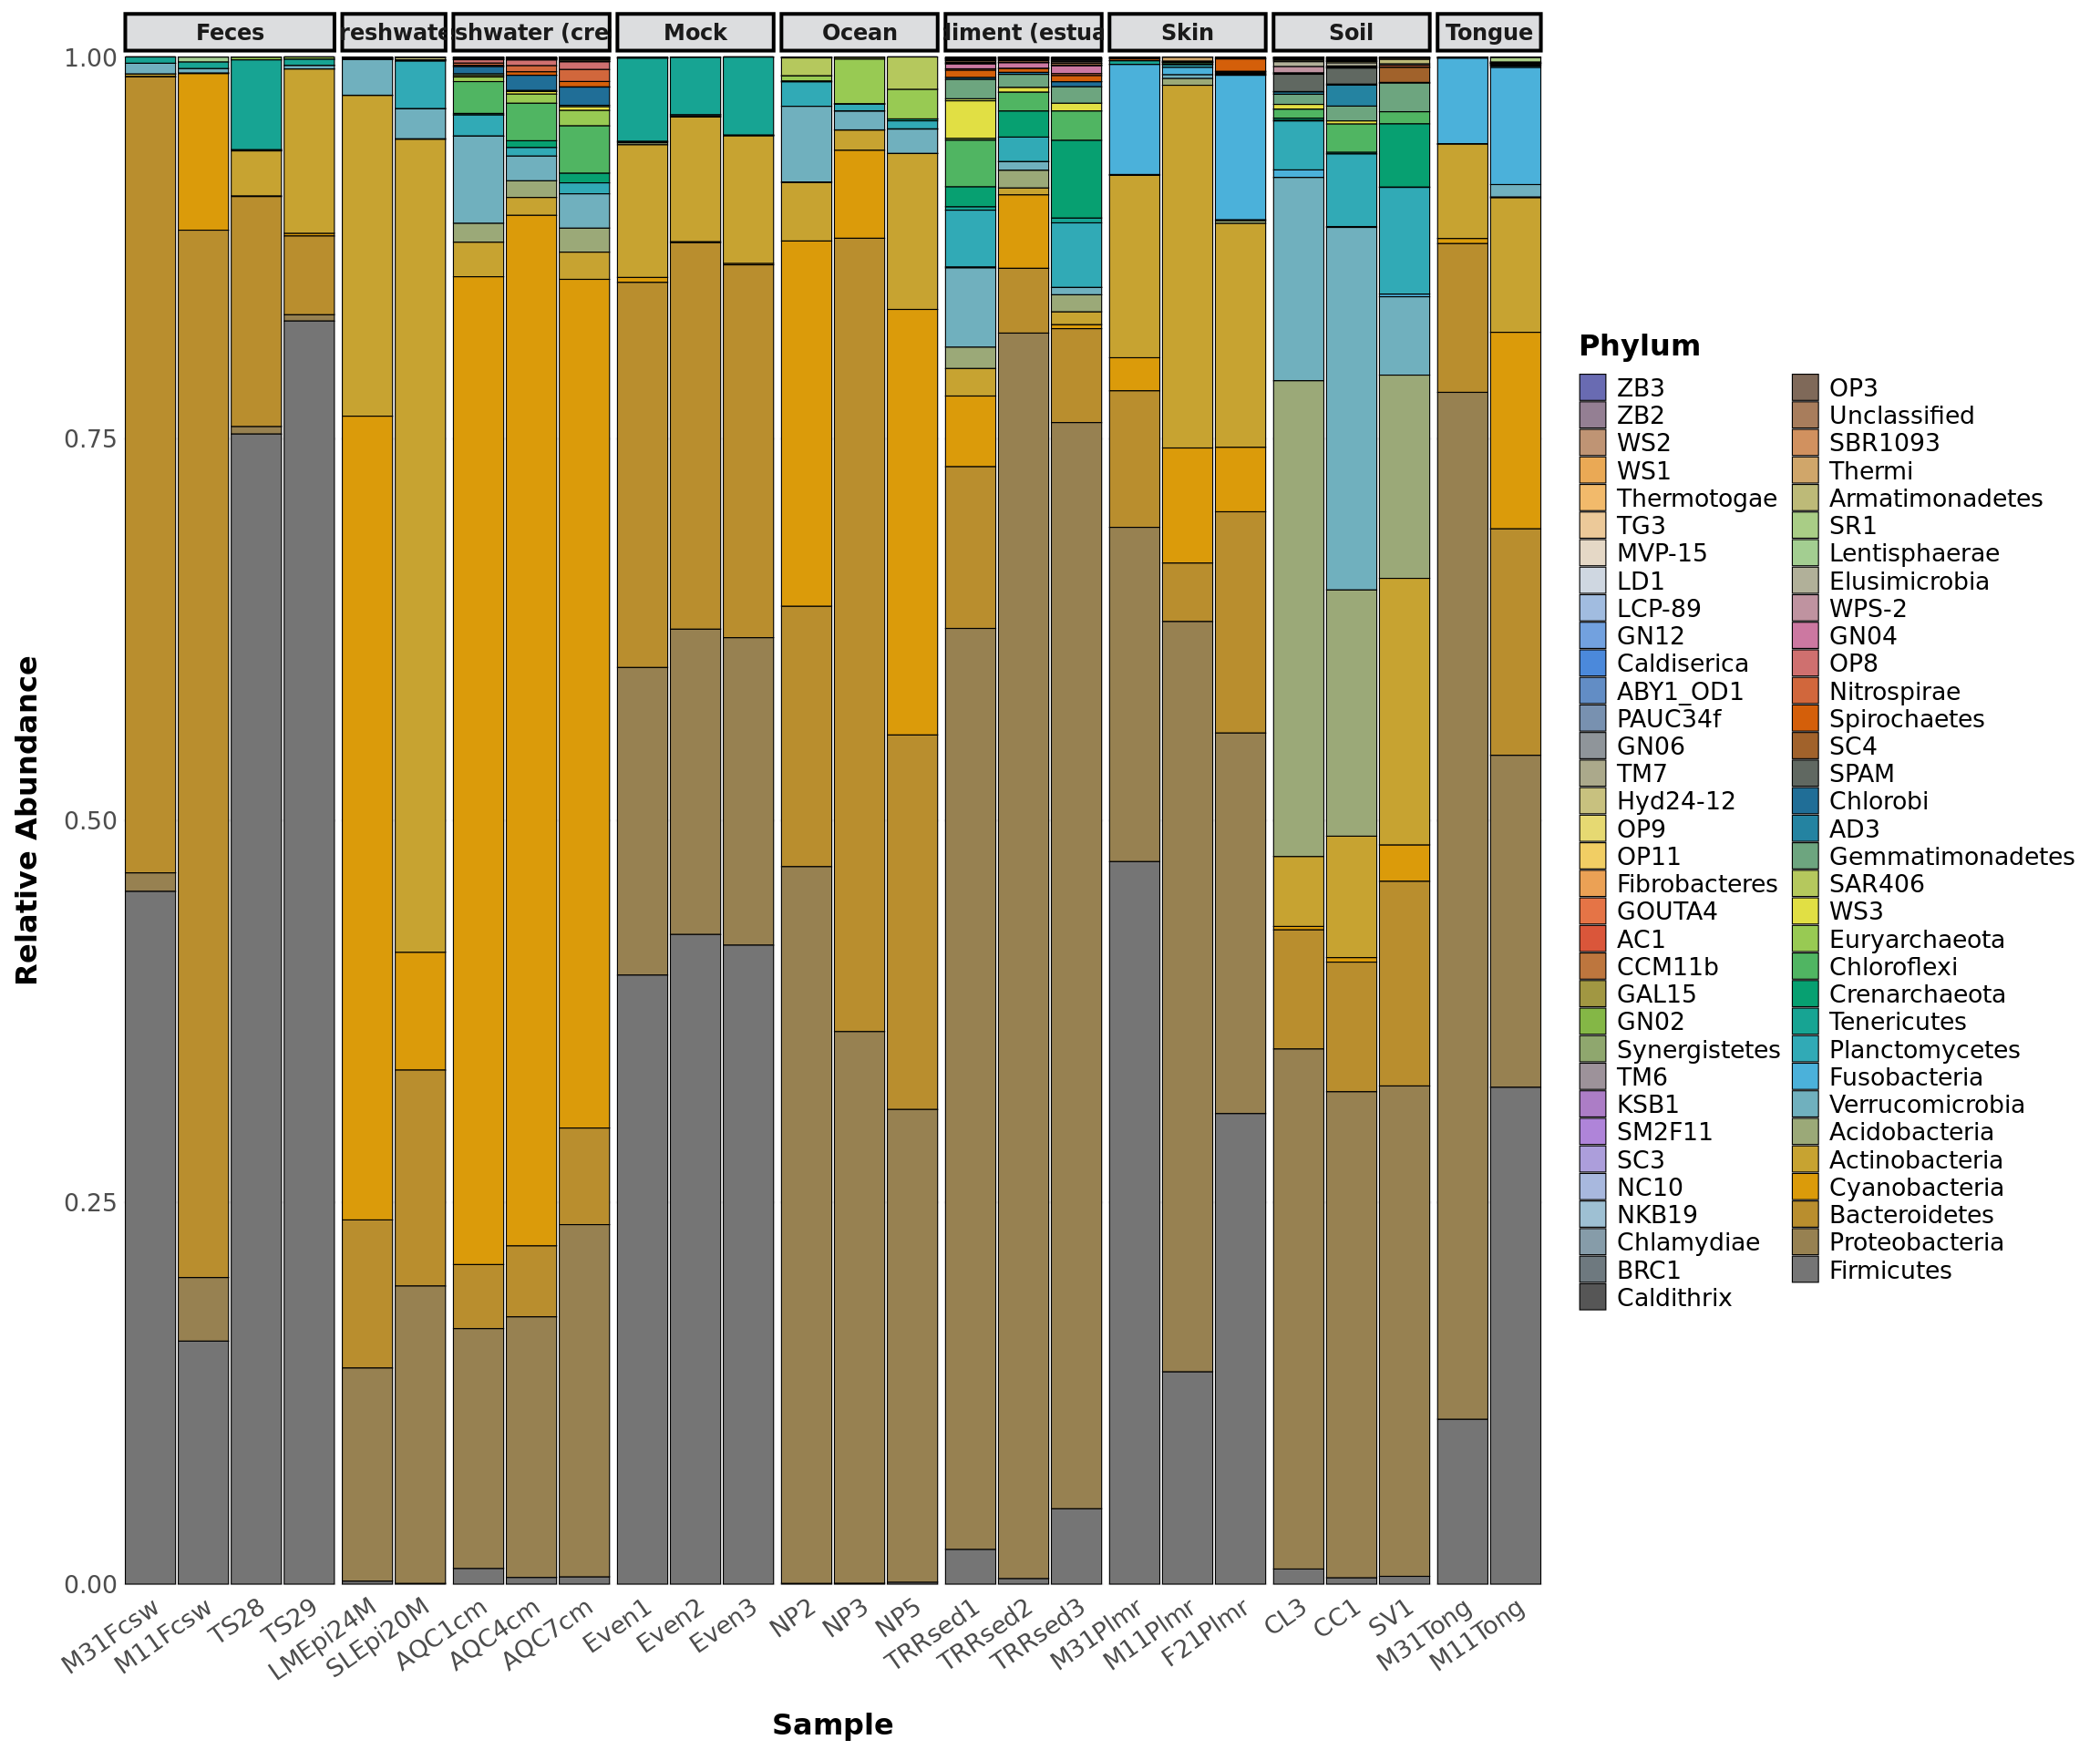
taxa_abundance_bars
Creates a ggplot object of the side-by-side bar plots of a classification level in the tax_data.
Usage
taxa_abundance_bars(phyloseq_obj, classification = NULL, treatment, subset = NULL, transformation = 'none', colors = 'default')
Arguments
| Call | Description |
|---|---|
phyloseq_obj |
A phyloseq-class object. |
phyloseq_obj |
A phyloseq-class object. |
classification |
Column name as a string in the tax_table for the factor |
to conglomerate by. treatment | Column name as a string, or vector of, in the sample_data. subset | A factor within the treatment. This will remove any samples that to not contain this factor. This can be a vector of multiple factors to subset on. transformation | Transformation to be used on the data. “none”, “mean”, “median”, “sd”, “log”, “log10” colors | Name of a color set from the RColorBrewer package or a vector palete of R-accepted colors.
Examples
filtered_obj <- taxa_filter(GlobalPatterns, frequency = 0.8)
taxa_abundance_bars(filtered_obj, classification = 'Phylum',
  treatment = "SampleType")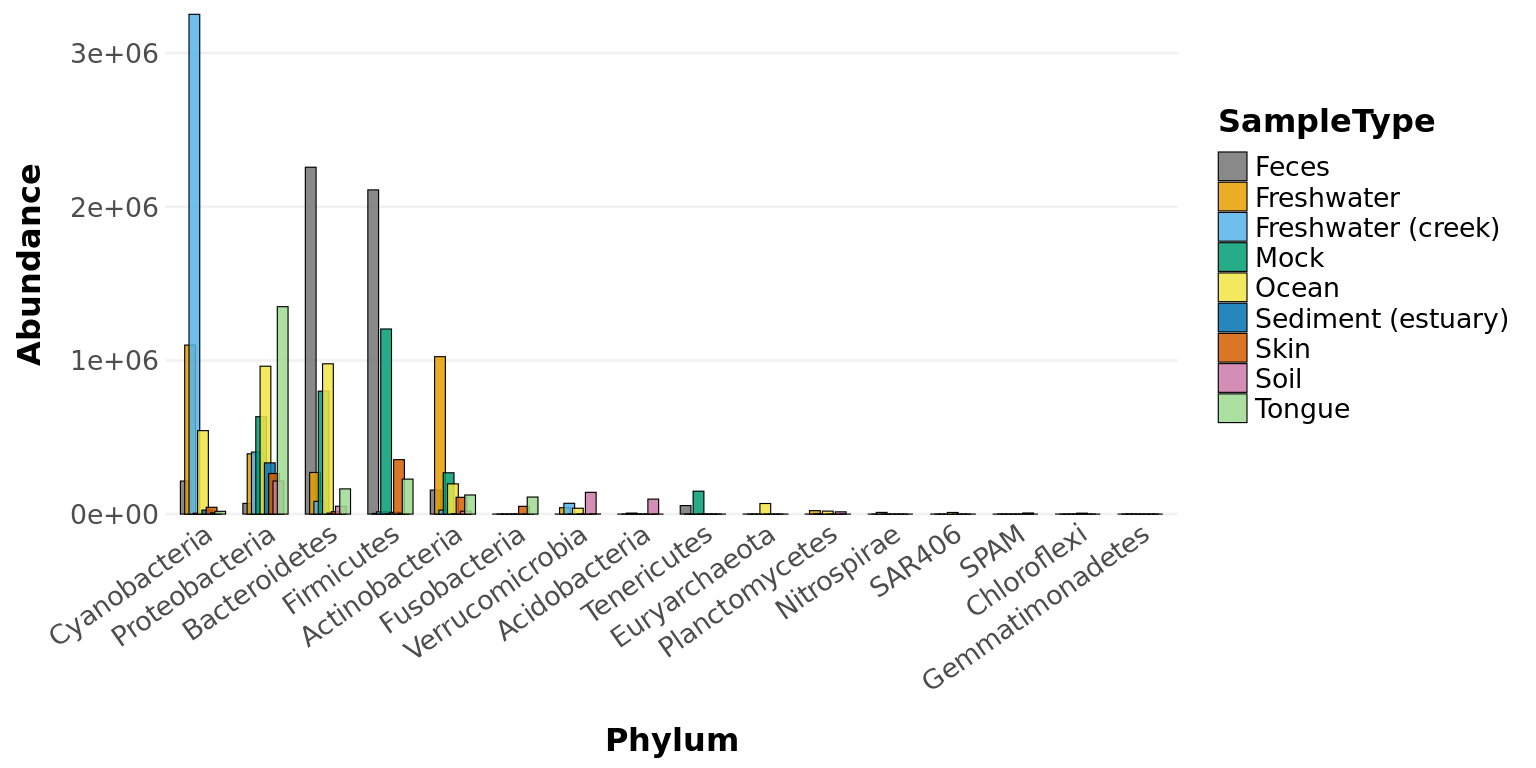
taxa_core_graph
Create graph of the core taxa seen in phyloseq-object over a range of abundance and smaple-frequency values.
Usage
taxa_core_graph(phyloseq_obj, treatment = NULL, subset = NULL,
  frequencies = seq(0.1, 1, 0.1), abundance_thresholds = seq(0.01, 1, 0.01),
  colors = 'default')
Arguments
| Call | Description |
|---|---|
phyloseq_obj |
A phyloseq-class object. |
classification |
Column name as a string in the tax_table for the factor |
to conglomerate by. treatment | Column name as a string, or vector of, in the sample_data. subset | A factor within the treatment. This will remove any samples that to not contain this factor. This can be a vector of multiple factors to subset on. frequencies | The range of proportions of samples the taxa are found in. abundance_thresholds | The range of minimum relative abundances the taxa are found in for each sample. colors | Name of a color set from the RColorBrewer package or a vector palete of R-accepted colors.
Examples
taxa_core_graph(GlobalPatterns, abundance_thresholds = seq(0.01, 0.25, 0.01))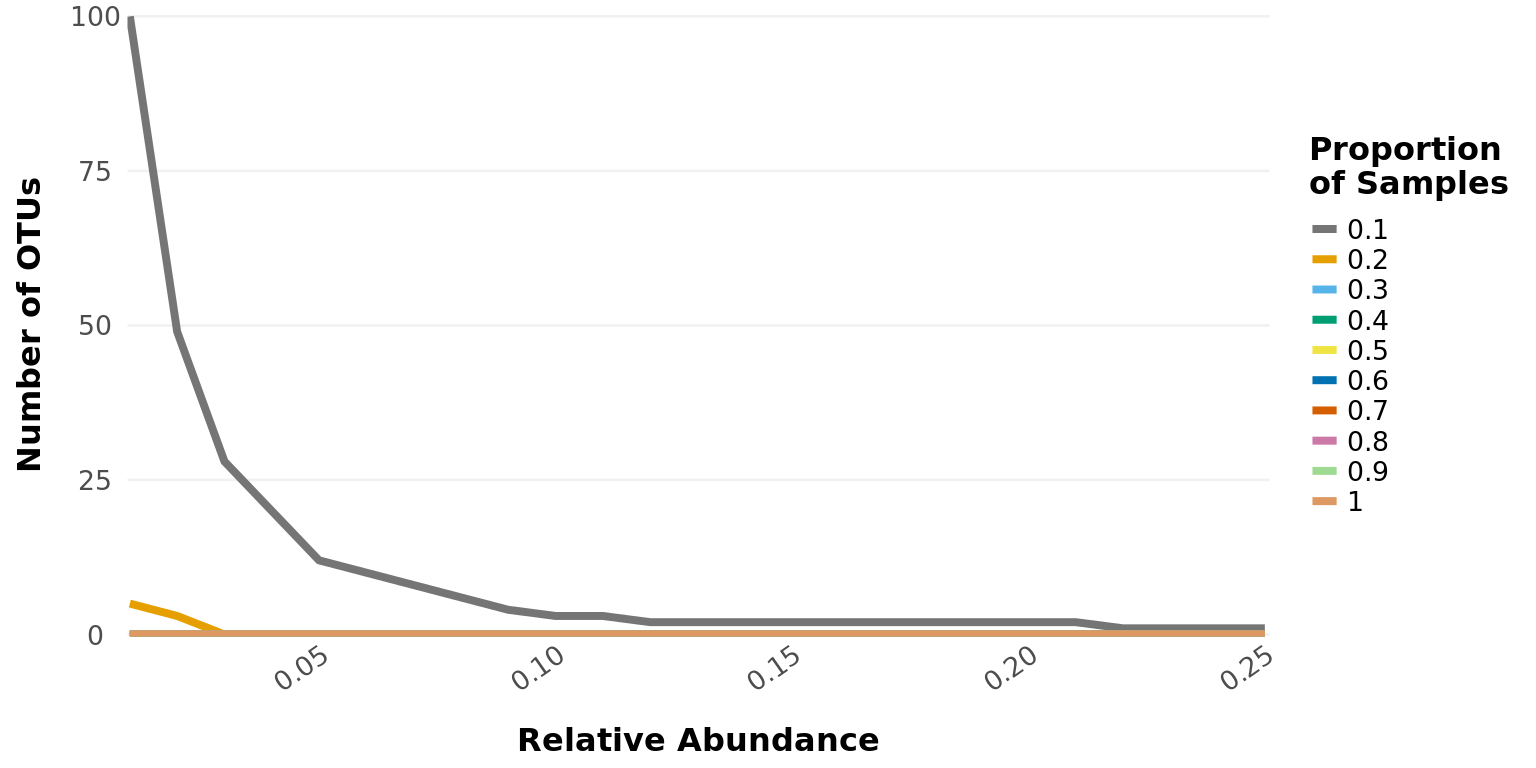
variable_correlation_heatmap
Computes the correlation of numerical variables with taxa and graphs as heatmap.
Usage
variable_correlation_heatmap(phyloseq_obj, variables,
  treatment = NULL, subset = NULL, classification = NULL,
  method = 'spearman', limits = c(-0.8, 0.8),
  colors = 'default', significance_color = 'white', cores = 1)
Arguments
| Call | Description |
|---|---|
phyloseq_obj |
A phyloseq-class object. |
variables |
Numerical factors within the in the sample_data to correlate with |
the abundance data. classification | Column name as a string in the tax_table for the factor to conglomerate by. treatment | Column name as a string, or vector of, in the sample_data. subset | A factor within the treatment. This will remove any samples that to not contain this factor. This can be a vector of multiple factors to subset on. method | Which correlation method to calculate, “pearson”, “spearman”. limits | The range for the legend, smaller limits will accentuate smaller correlations. colors | Name of a color set from the RColorBrewer package or a vector palete of R-accepted colors. significance_color | the color to use for the significance stars. cores numeric value for number of CPU cores to use for the pair-wise permutations. Default (1), 0 uses max cores available. Parallelization not available for systems running MacOS without openMP configuration.
Examples
filtered_obj <- phyloseq::subset_samples(enterotype,
  !is.na(enterotype@sam_data$ClinicalStatus))
filtered_obj <- taxa_filter(filtered_obj, frequency = 0.65)
variable_correlation_heatmap(filtered_obj, variables = 'Age',
 treatment = "ClinicalStatus", subset = c("healthy", "elderly", "obese"),
 classification = 'Genus', method = 'spearman', cores = 1,
 significance_color = 'black')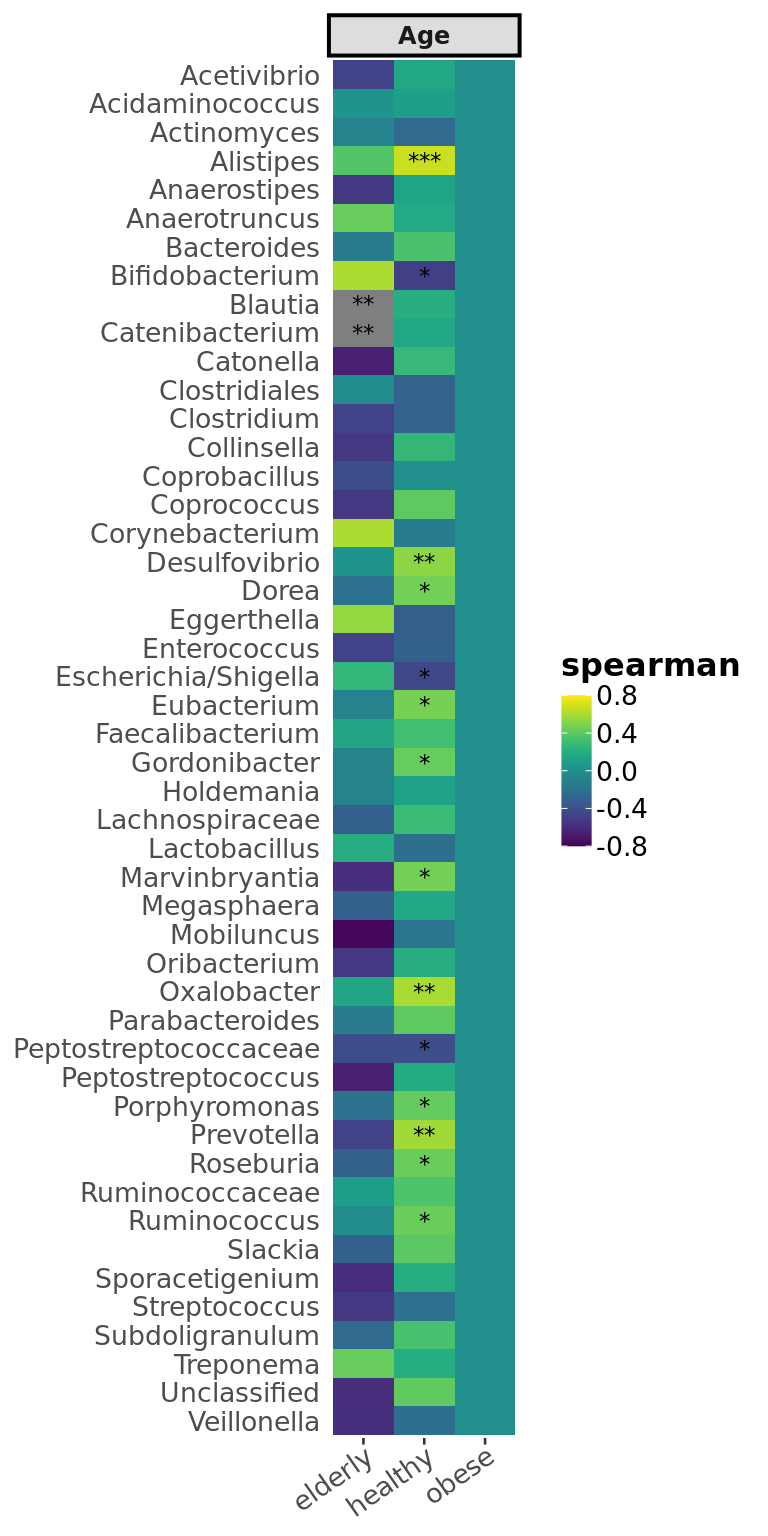
Diversity
alpha_diversity_graph
Create a ggplot-object box-plot of the alpha-diversity from a phyloseq-object.
Usage
alpha_diversity_graph(phyloseq_obj, index = 'shannon', treatment = NULL,
  subset = NULL, colors = 'default')
Arguments
| Call | Description |
|---|
phyloseq_obj | A phyloseq-class object. index | The diversity index to calculate (‘shannon’, ‘simpson’, ‘invsimpson’) treatment | Column name as a string, or vector of, in the sample_data. subset | A factor within the treatment. This will remove any samples that to not contain this factor. This can be a vector of multiple factors to subset on. colors | Name of a color set from the RColorBrewer package or a vector palete of R-accepted colors.
Examples
alpha_diversity_graph(GlobalPatterns, index = 'shannon', treatment = "SampleType",
  subset = NULL, colors = 'default')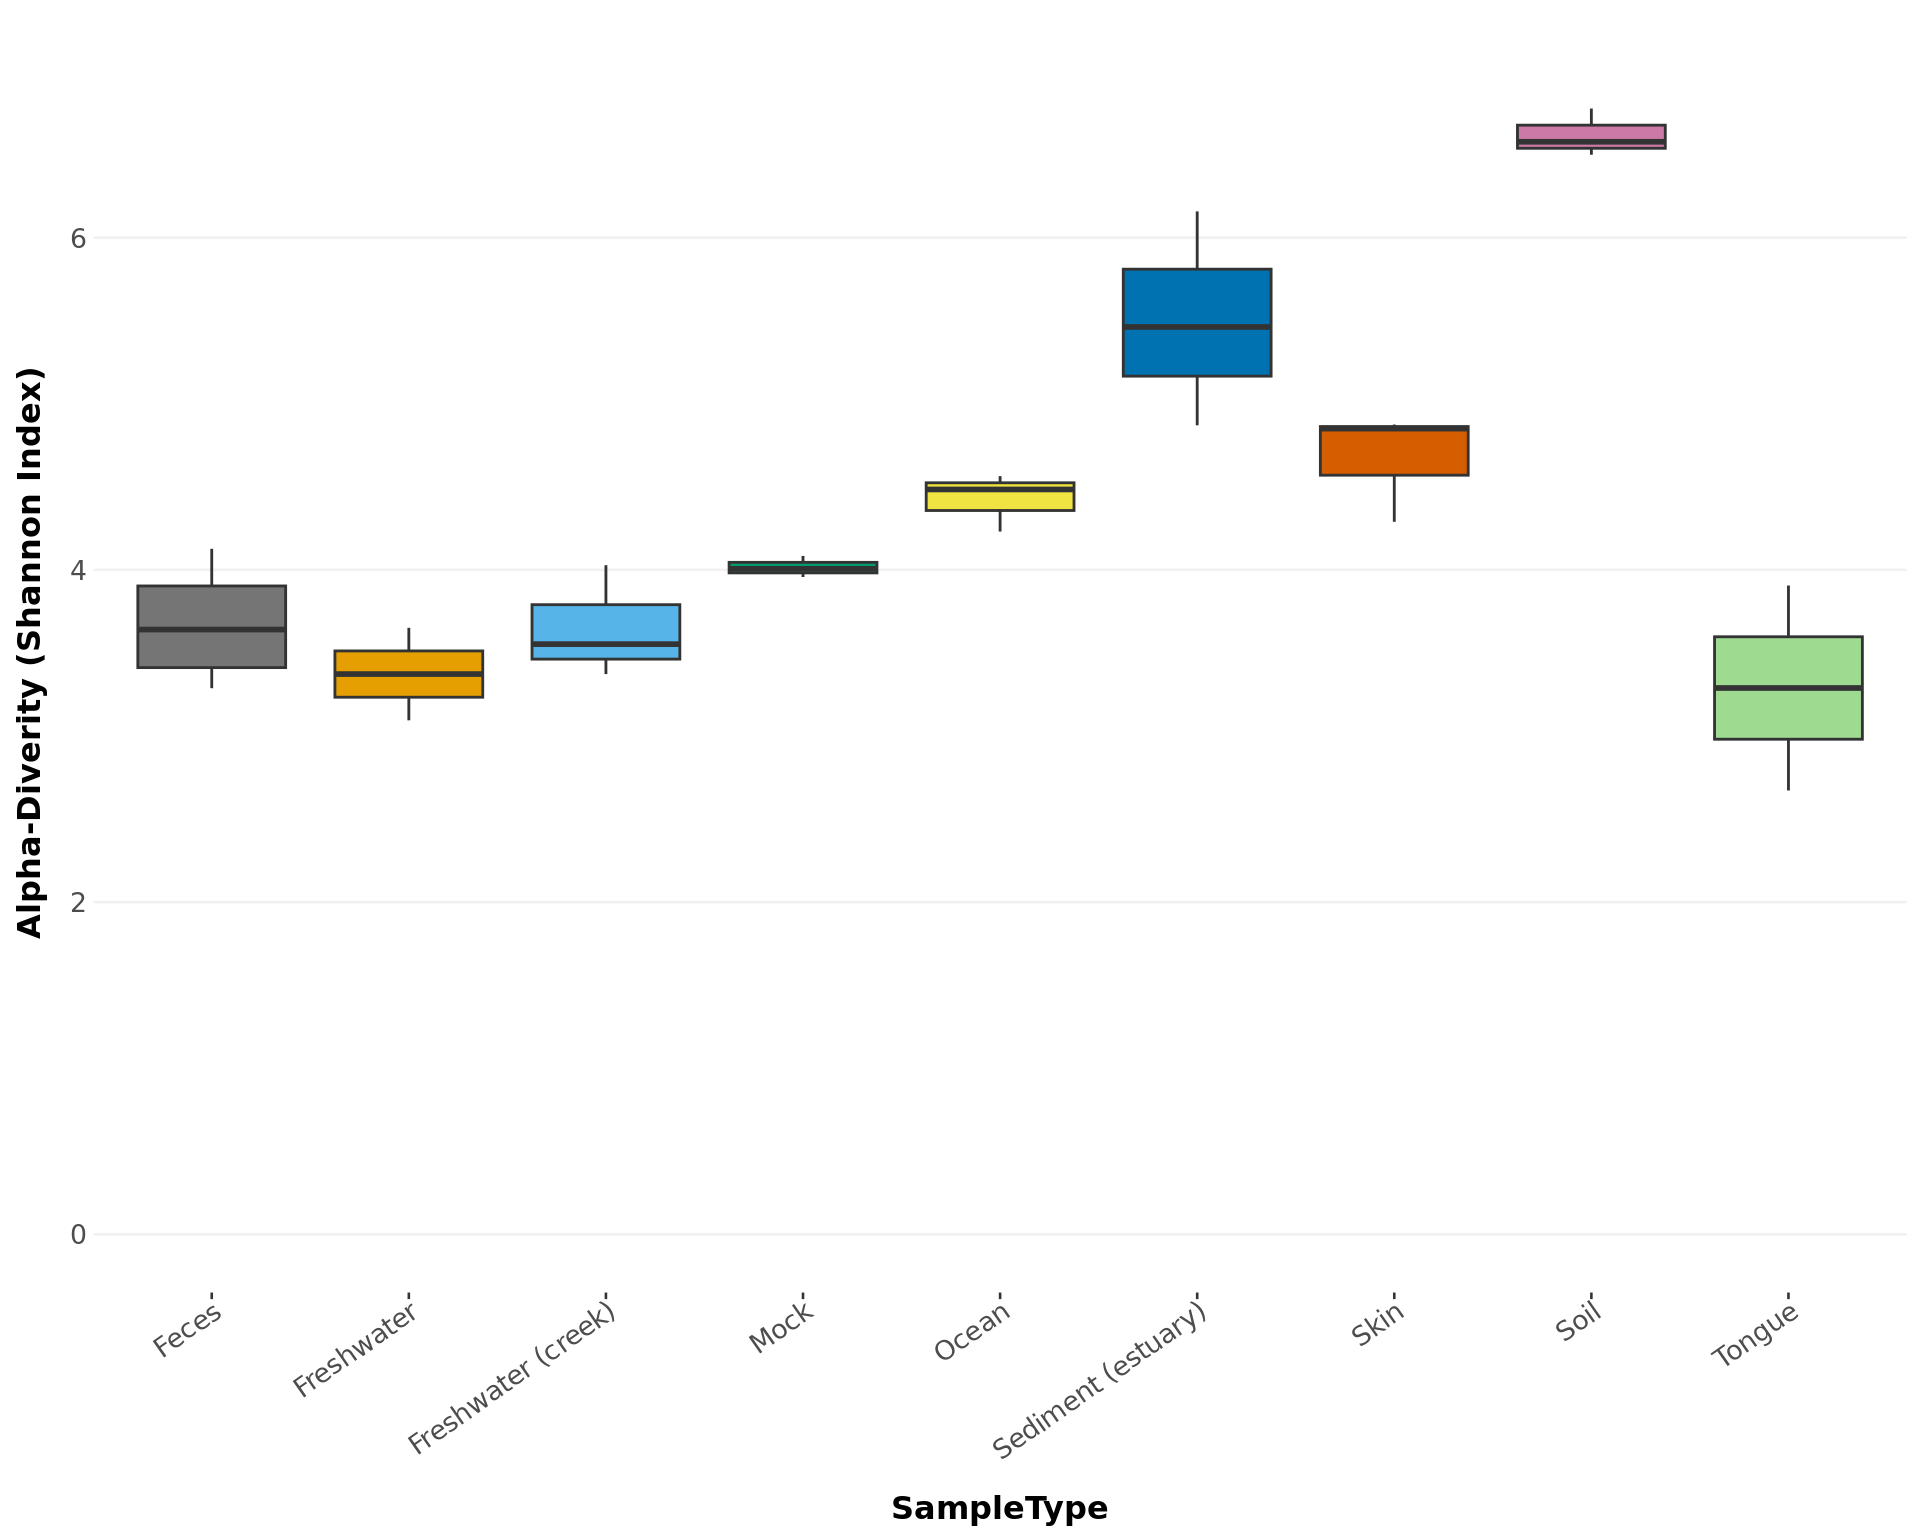
dendrogram_phyloseq
Create a ggplot-object dendrogram of the distance measure from a phyloseq-object.
Usage
dendrogram_phyloseq(phyloseq_obj, treatment = NULL, method = 'bray',
  colors = 'default')
Arguments
| Call | Description |
|---|
phyloseq_obj | A phyloseq-class object. treatment | Column name as a string, or vector of, in the sample_data. colors | Name of a color set from the RColorBrewer package or a vector palete of R-accepted colors. method | the distance measurement algorithm to use from “manhattan”, “euclidean”, “canberra”, “bray”, “kulczynski”, “gower”, “morisita”, “horn”, “mountford”, “jaccard”, “raup”, “binomial”, “chao”, “altGower”, “cao”, “mahalanobis”, “clark”
Examples
dendrogram_phyloseq(GlobalPatterns, "SampleType", method = 'bray')## Registered S3 method overwritten by 'dendextend':
## method from
## rev.hclust vegan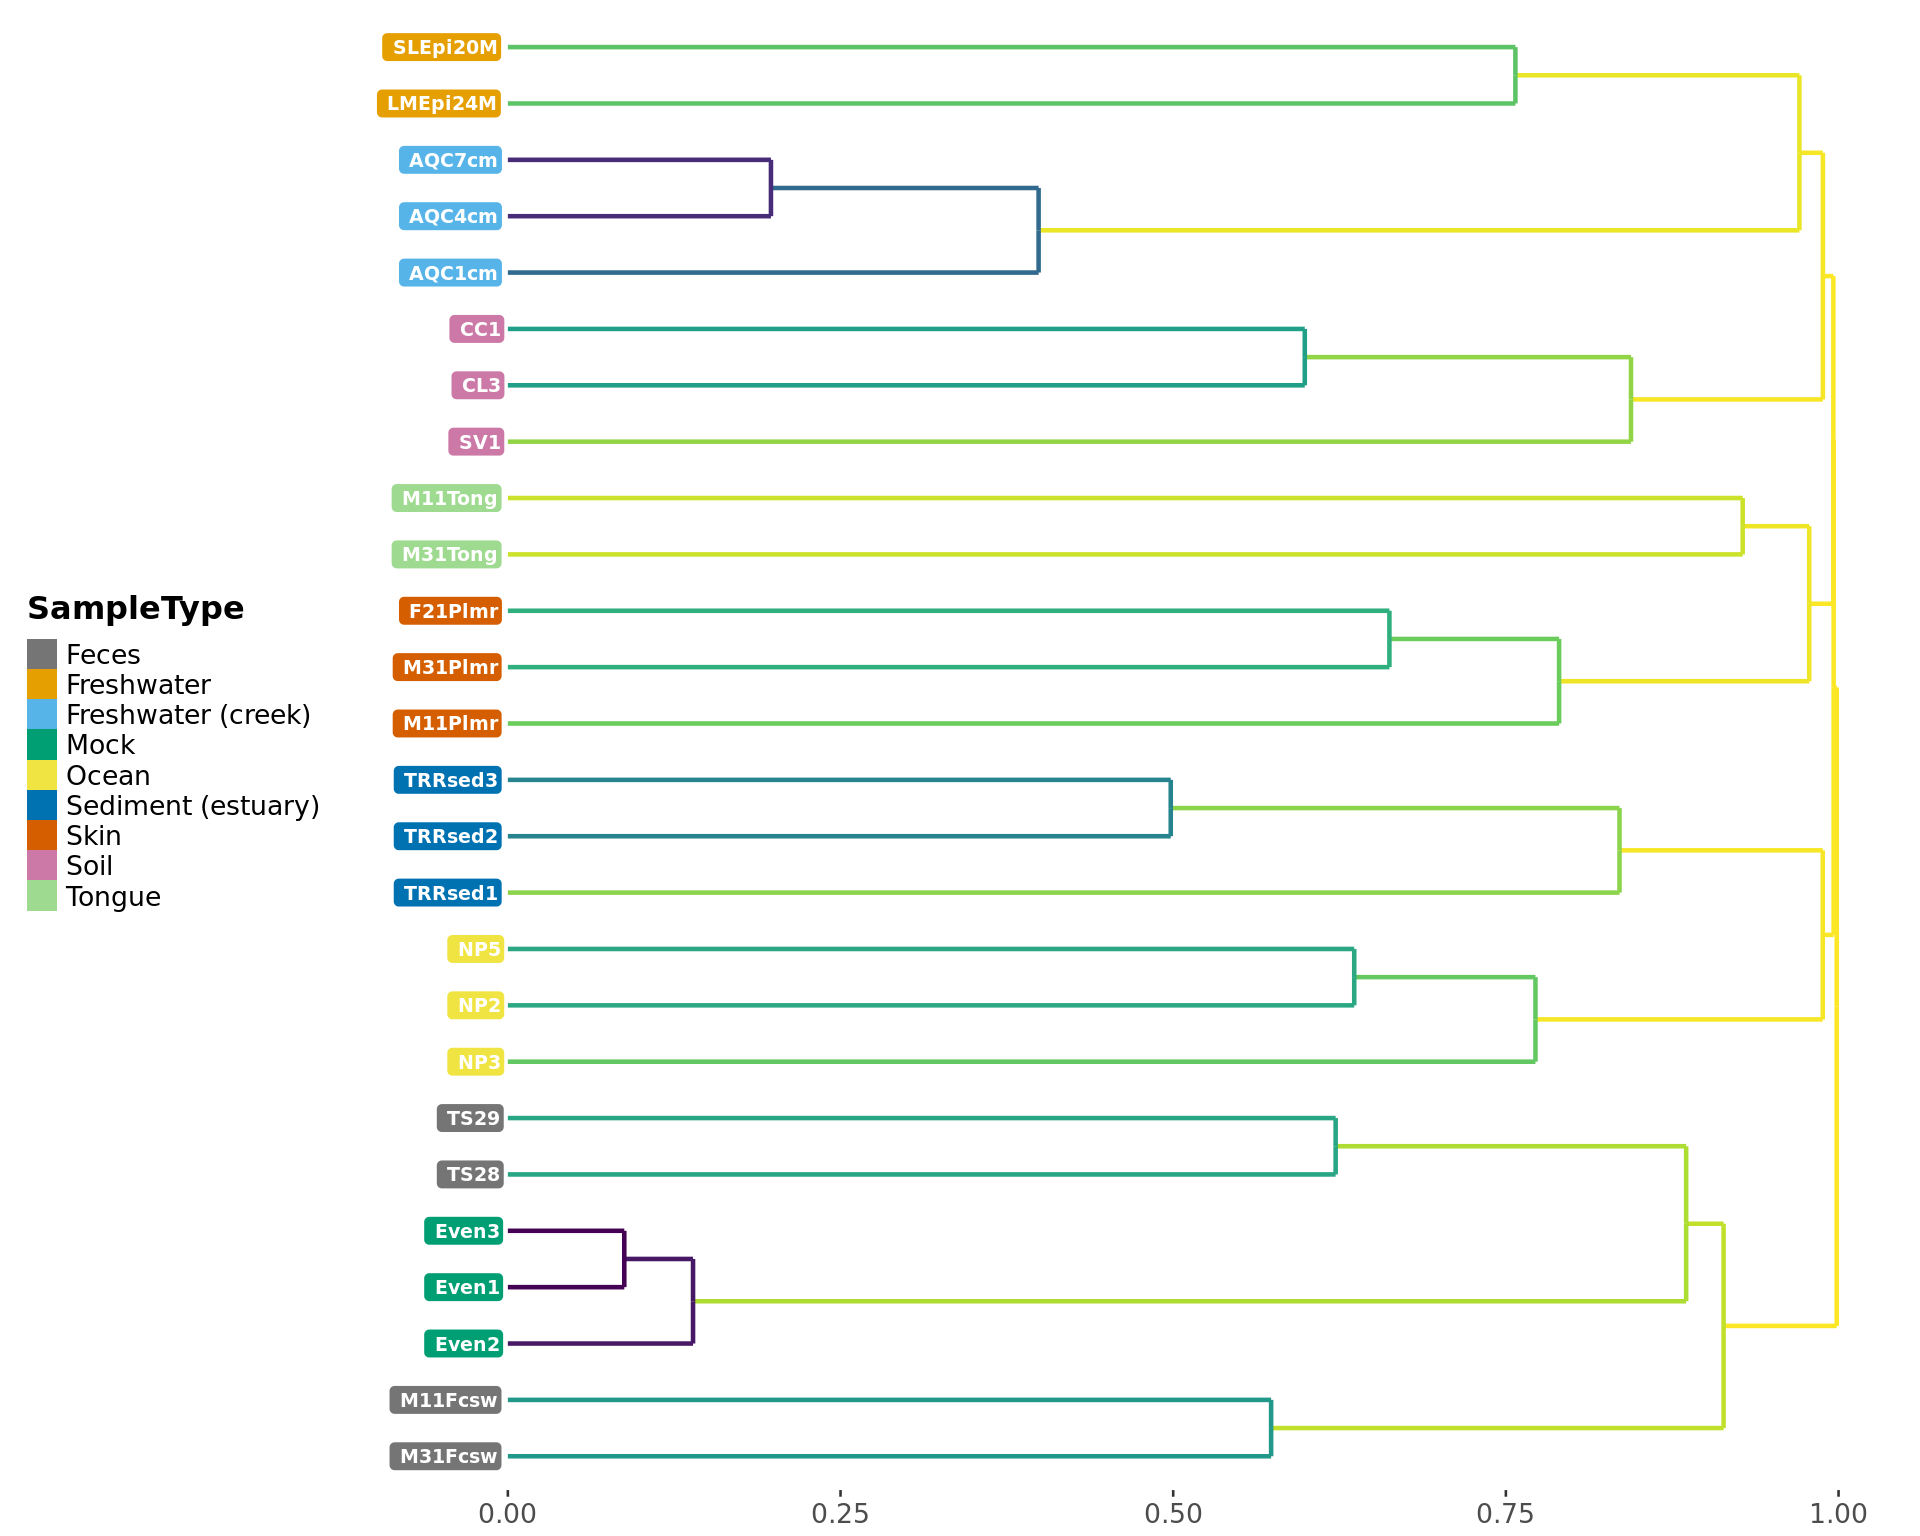
nmds_phyloseq
Creates a ggplot object of the NMDS ordination of samples.
Usage
nmds_phyloseq(phyloseq_obj, treatment, circle = TRUE, labels = FALSE,
  colors = 'default', verbose = TRUE)
Arguments
| Call | Description |
|---|---|
phyloseq_obj |
A phyloseq-class object. |
treatment |
Column name as a string, or vector of, in the sample_data. |
circle |
Whether to add a stat_elipse around eache treatment factor on the graph. |
labels |
Column name as a string or numeric in the sample_data to use to place labels of that factor instead of circle points. |
colors |
Name of a color set from the RColorBrewer package or a vector palete of R-accepted colors. |
verbose |
Whether or not to print the vegan::metaMDS stress convergence to console (TRUE) or not (FALSE). |
Examples
nmds_phyloseq(GlobalPatterns, c("SampleType"), circle = TRUE, verbose = FALSE)## Too few points to calculate an ellipse
## Too few points to calculate an ellipse
## Too few points to calculate an ellipse
## Too few points to calculate an ellipse
## Too few points to calculate an ellipse
## Too few points to calculate an ellipse
## Too few points to calculate an ellipse
## Too few points to calculate an ellipse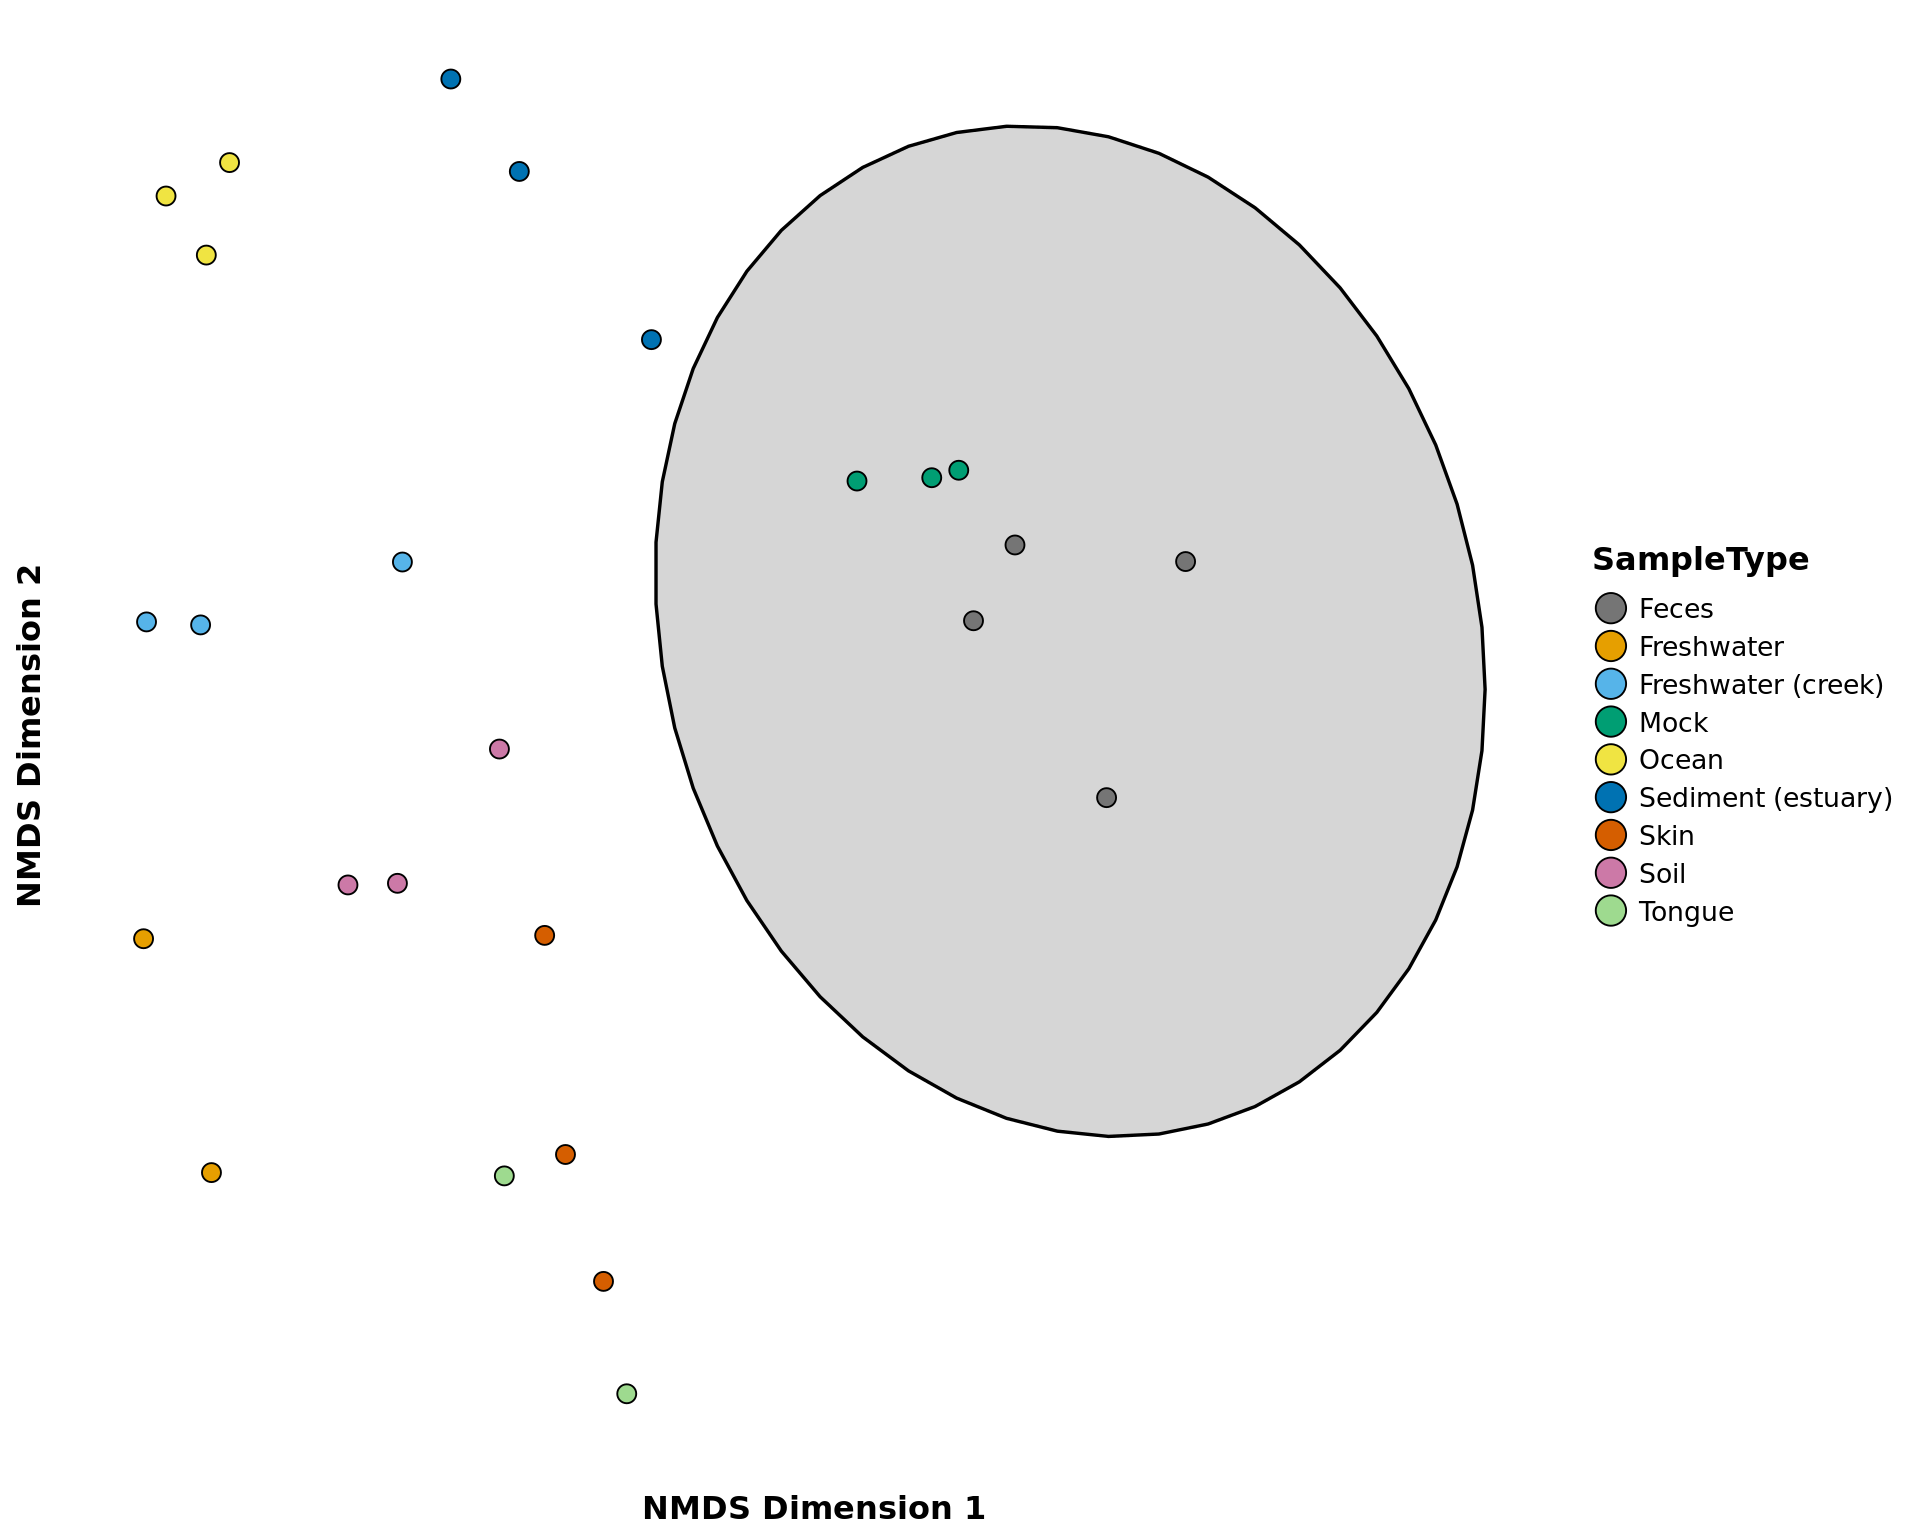
pcoa_phyloseq
Creates a ggplot object of the NMDS ordination of samples.
Usage
pcoa_phyloseq(phyloseq_obj, treatment, x = 1, y = 2, method = 'bray',
  circle = 0.95, colors = 'default', labels = NULL)
Arguments
| Call | Description |
|---|---|
phyloseq_obj |
A phyloseq-class object. |
treatment |
Column name as a string, or vector of, in the sample_data. |
x |
the numerical principle compenent to use as the x-axis. |
y |
the numerical principle compenent to use as the y-axis. |
method |
the distance measurement algorithm to use from “manhattan”, “euclidean”, “canberra”, “bray”, “kulczynski”, “gower”, “morisita”, “horn”, “mountford”, “jaccard”, “raup”, “binomial”, “chao”, “altGower”, “cao”, “mahalanobis”, “clark” |
circle |
Whether to add a stat_elipse around eache treatment factor on the graph. |
labels |
Column name as a string or numeric in the sample_data to use to place labels of that factor instead of circle points. |
colors |
Name of a color set from the RColorBrewer package or a vector palete of R-accepted colors. |
Examples
pcoa_phyloseq(GlobalPatterns, "SampleType", circle = FALSE)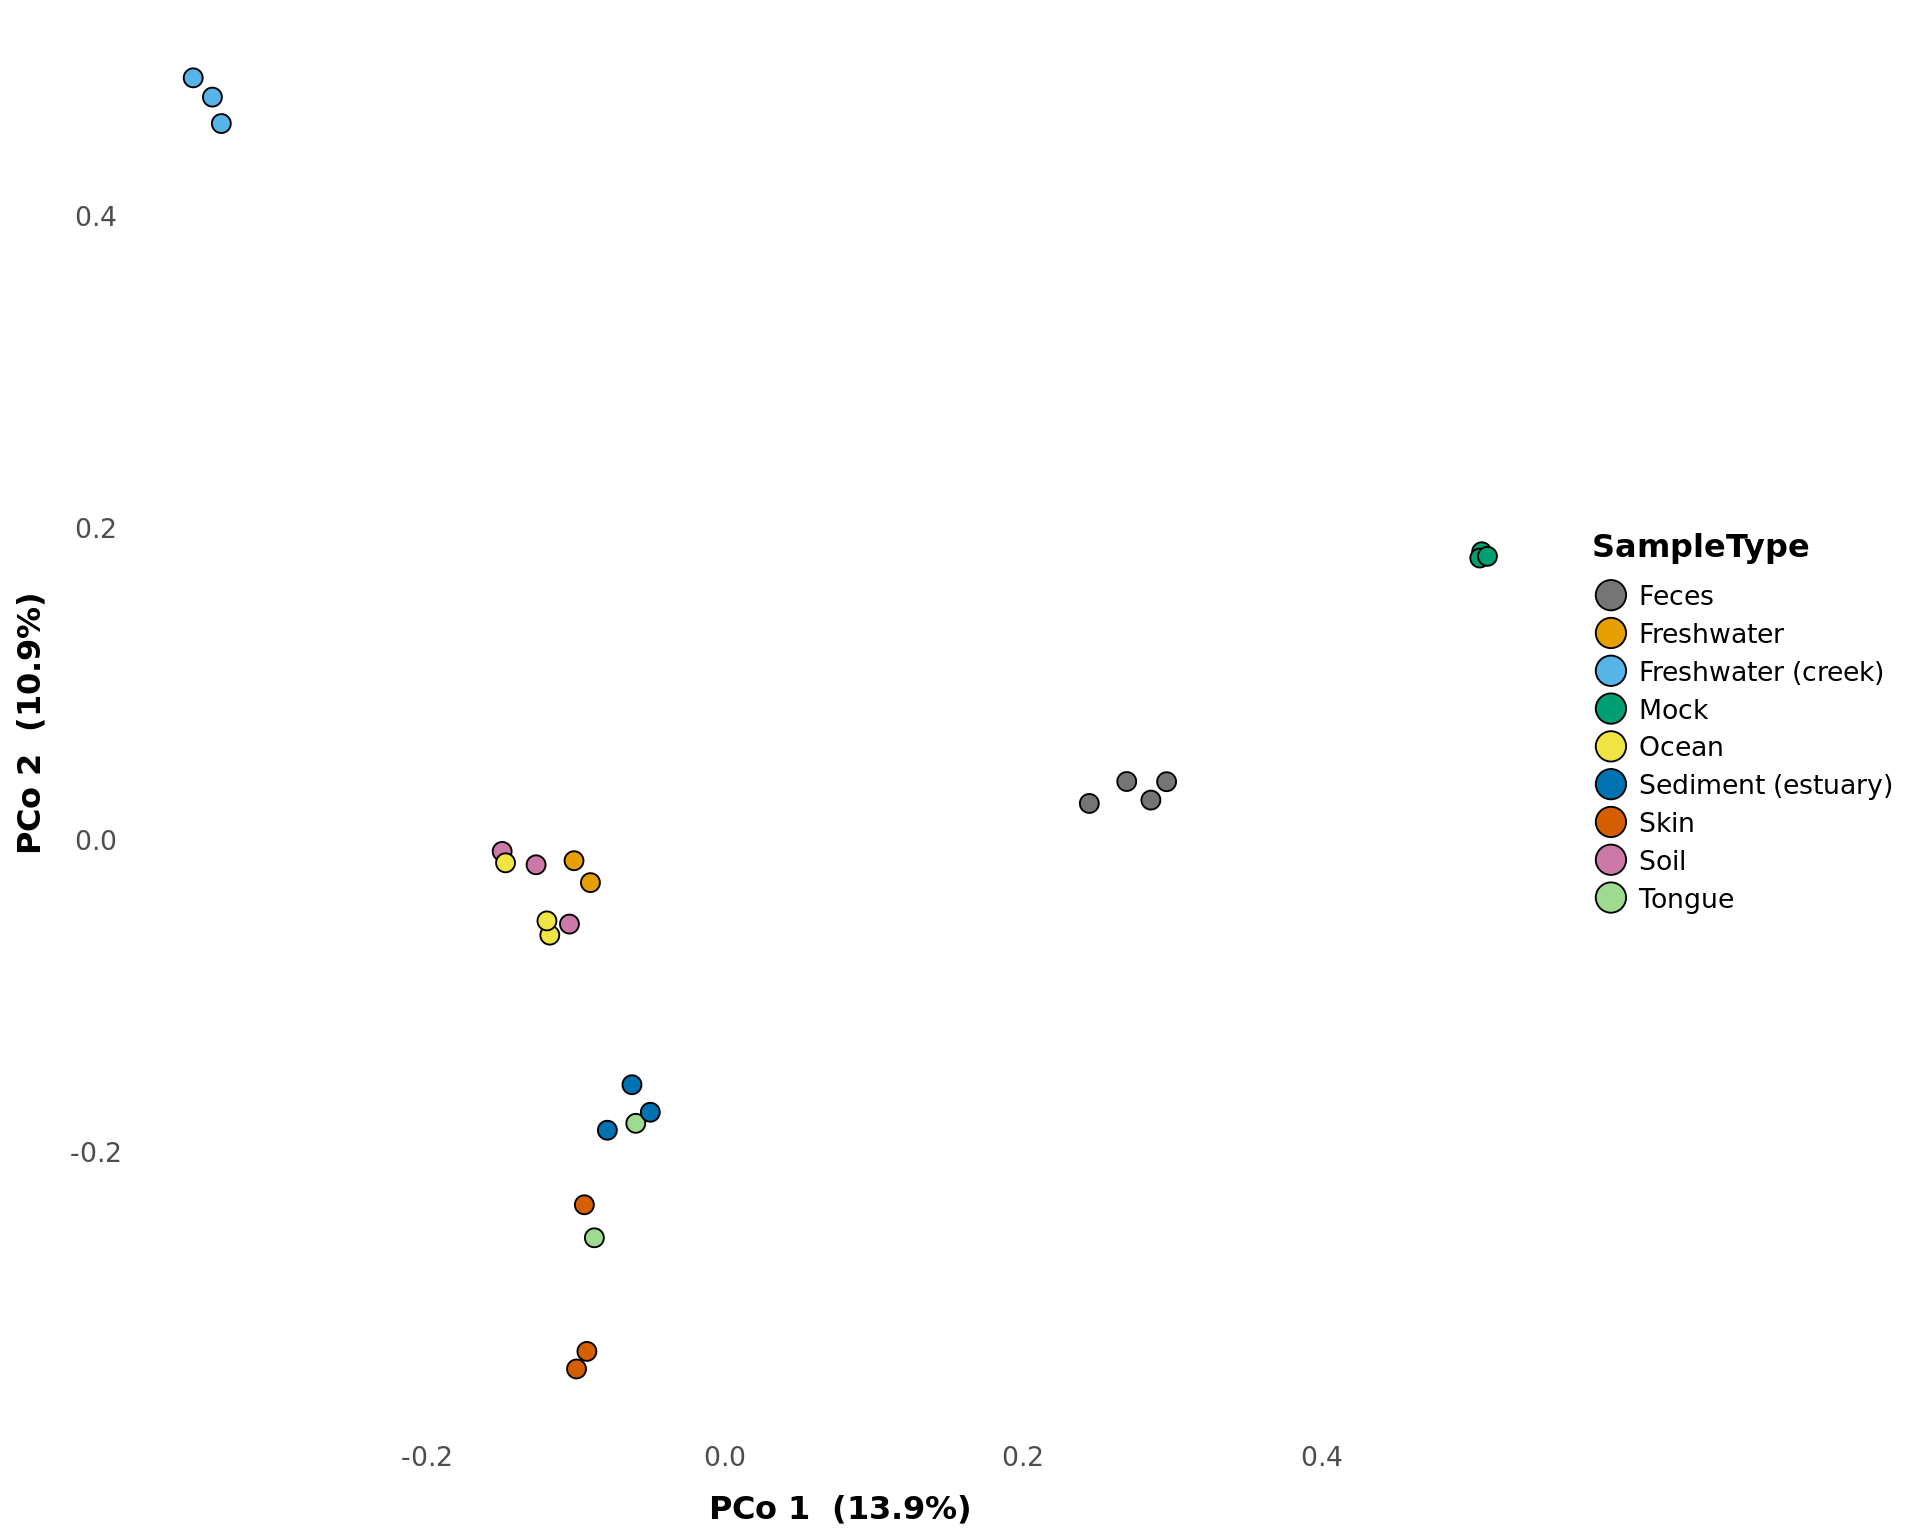
tsne_phyloseq
Creates a ggplot object of the t-SNE ordination of the samples. t-Distributed Tochastic Neighbor Embedding is a machine learning algorithm of nonlinear dimensionality reduction for high-dimensional data.
Usage
tsne_phyloseq(phyloseq_obj, treatment, perplexity = 10, circle = FALSE,
  labels = FALSE, colors = 'default')
Arguments
| Call | Description |
|---|---|
phyloseq_obj |
A phyloseq-class object. |
treatment |
Column name as a string, or vector of, in the sample_data.vector of multiple columns and they will be combined into a new column. |
perplexity |
similar to selecting the number of neighbors to consider in decision making (should not be bigger than 3 * perplexity < nrow(X) - 1, see Rtsne for interpretation) |
circle |
Whether to add a stat_elipse around each treatment factor on the graph. |
labels |
Column name as a string or numeric in the sample_data to use to place labels of that factor instead of circle points. |
colors |
Name of a color set from the RColorBrewer package or a vector palete of R-accepted colors. |
Examples
tsne_phyloseq(GlobalPatterns, treatment = "SampleType", perplexity = 5,
  circle = FALSE)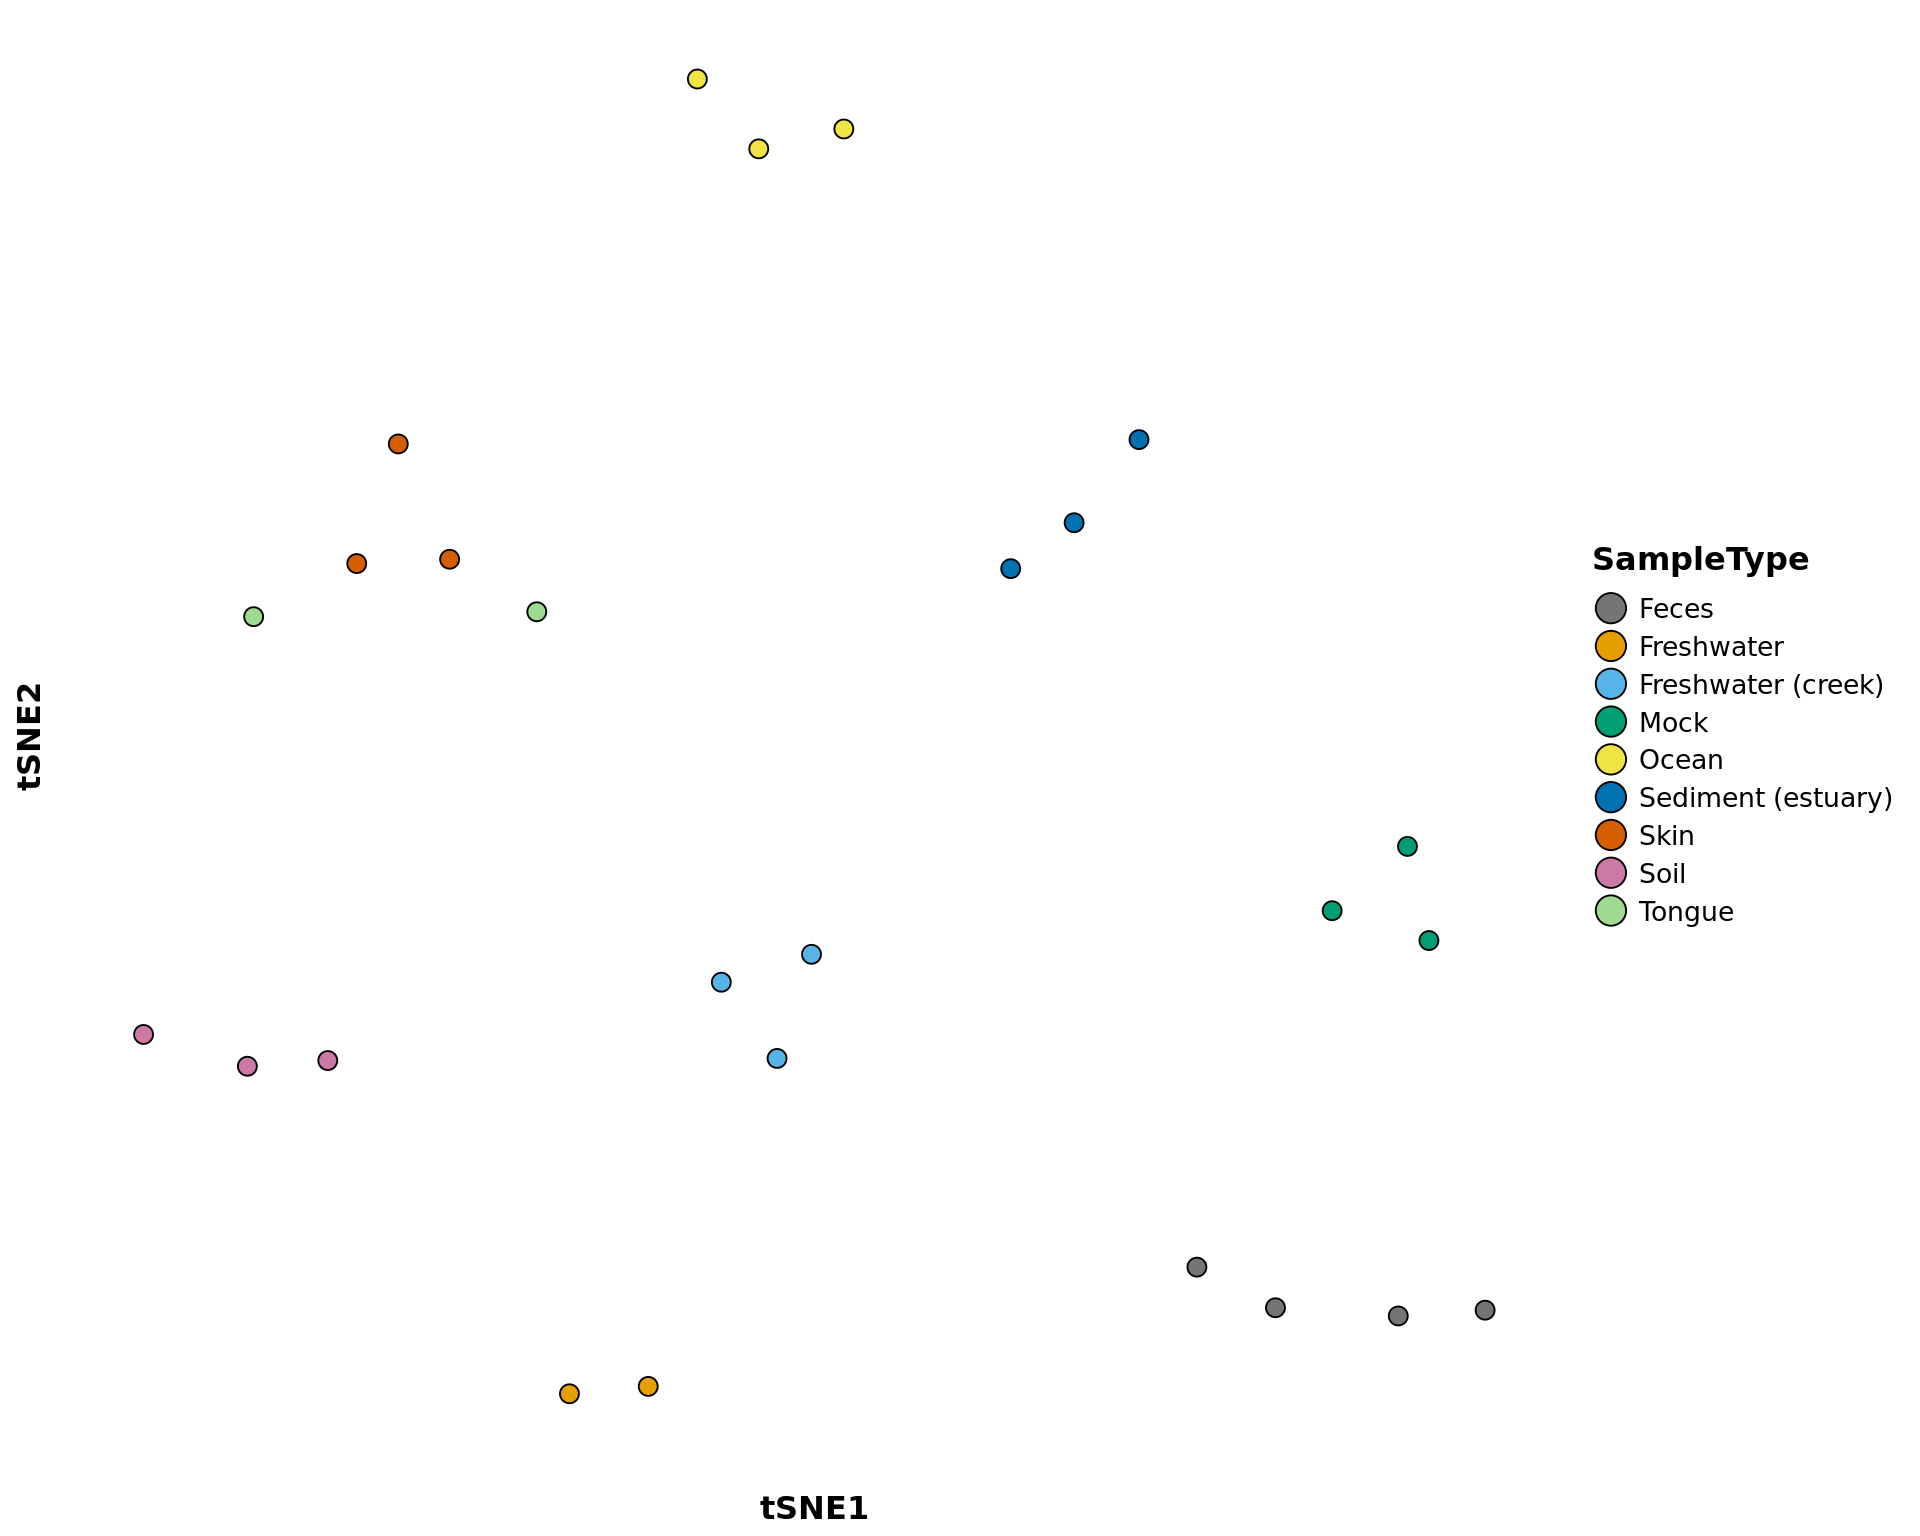
Schuyler Smith
Ph.D. Bioinformatics and Computational Biology