All ARGs Found
Profiles
classification <- 'Class'
treatment_name <- 'Matrix'

missing <- unique(sort(as.character(SC_I$ARG)))
genes <- as.character(SC_I$ARG)
for(i in seq_along(missing)){
  genes[genes %in% missing[i]] <- c(
    "AAC(2')", "AAC(2')", "AAC(3)", "AAC(3)", "AAC(3)", "AAC(6')", "AAC(6')", "AAC(3)", "AAC(6')", "AAC(6')",
    "AAC(6')", "AAC(6')", "AAC(6')", "ANT(6)", "aadA", "aadA", "aadA", "aadA", "aadA", "aadA", "aadA", "aadA",
    "aadA", "aadA", "aadA", "aadA", "aadA", "aadA", "aadA", "ACI", "acrA", "acrB", "acrD", "AcrF", "AdeB",
    "AdeF", "AdeI", "AdeJ", "AIM", "AmrA", "AmrB", "ANT(4')", "ANT(6)", "ANT(6)", "ANT(9)", "APH(2'')",
    "APH(2'')", "APH(2'')", "APH(3'')", "APH(3'')", "APH(3'')", "APH(3'')", "APH(3'')", "APH(3'')", "APH(3'')",
    "APH(4)", "APH(6)", "APH(6)", "APH(6)", "APH(6)", "AQU", "arnA", "ARR-1", "Axy", "Axy", "BcI", "BcII",
    "bcr", "BJP", "blaA", "BlaA", "BlaB", "blaF", "blaL", "BUT-1", "CARA", "CARB", "CARB", "CARB", "cat",
    "cat", "cat", "catB", "catB", "catQ", "ceoA", "ceoB", "cfr(C)", "CfxA", "CfxA", "clbA", "cml", "cmlV", "cmx",
    "cpxa", "crp", "CTX-M", "CTX-M", "dfrA", "dfrA", "dfrA", "dfrB", "dfrD", "dfrG", "efpA", "efrA", "EreB",
    "Erm", "Erm", "Erm", "Erm", "Erm", "ErmA", "ErmB", "ErmC", "ErmF", "ErmG", "ErmQ", "ErmT", "ErmX", "ErmY",
    "EXO", "facT", "FAR", "FEZ", "floR", "FosB", "fusH", "gadX", "GES", "gyrA", "ileS", "iri", "JOHN",
    "linG", "lnuA", "lnuB", "lnuC", "lnuD", "lnuF", "lnuG", "LRA", "LRA", "LRA", "LRA", "LRA", "LRA", "lrfA",
    "lsaB", "lsaC", "lsaE", "macB", "mdsB", "mdsC", "mdtA", "mdtB", "mdtC", "mdtF", "mdtG", "mdtK", "mdtN",
    "mdtO", "mefA", "mefB", "mefC", "mel", "MexA", "MexB", "MexC", "MexD", "MexE", "MexF", "MexI", "MexK",
    "MexL", "MexM", "MexN", "MexQ", "MexV", "MexW", "MexX", "MexY", "mgtA", "MOX", "mphB", "mphD", "mphG",
    "mphL", "mprF", "msrA", "msrE", "mtrA", "mtrD", "mupA", "MuxA", "MuxB", "MuxC", "novA", "npmA", "OCH", "OCH",
    "OCH", "OKP-B", "oleB", "oleC", "oleD", "opcM", "OpmB", "OpmE", "OpmH", "OprA", "OprM", "OprN", "OprZ",
    "optrA", "oqxB", "otrA", "otrB", "otrC", "OXA", "OXA", "OXA", "OXA", "OXA", "OXA", "OXA", "OXA", "OXA", "OXA",
    "patA", "PDC", "PmpM", "pmrE", "qacH", "QepA", "QnrB", "RbpA", "rgt1438", "Rm3", "rmtF", "rphA", "rphB",
    "SAT", "SAT", "SAT", "SME", "smeB", "smeC", "smeD", "smeE", "smeF", "smeR", "smeS", "spd", "SPG", "srmB",
    "str", "sul1", "sul2", "TaeA", "tap", "tcmA", "tcr3", "TEM", "tet", "tet", "tet", "tet", "tet", "tet", "tet",
    "tet", "tet", "tetA", "tetC", "tetD", "tetG", "tetH", "tetJ", "tetL", "tetV", "tetW", "tetY", "tetZ",
    "tet", "tet", "tetA", "tetA", "tetB", "tetM", "tetO", "tetQ", "tetS", "tetT", "tetW", "tetX", "tlrC", "TolC",
    "TriA", "triC", "VanH", "vanJ", "vanO", "vanR", "vanR", "VanR", "VanR", "VanS", "VanS", "VanS", "VanS",
    "VanT", "VanX", "VanXY", "vatE", "vatH", "vgaA", "vgaB", "vgaE")[i]
}
set(SC_I, j = 'ARG', value = factor(genes, levels = unique(genes)))

graph_data <- melt(read_counts, id.vars = c('Class', 'Family', 'Gene', 'Target'), variable.name = 'Sample_Name')
graph_data <- graph_data[Gene != 'spike']
graph_data <- graph_data[!(Gene %in% c('16S'))]
graph_data <- merge(metadata[,c(1,2,4)], graph_data, by.x = 'ID', by.y = 'Sample_Name')
graph_data <- graph_data[, sum(value), by = c('Sample', 'Matrix', 'Class', 'Family', 'Gene', 'Target')]

set(graph_data, j = classification, value = factor(graph_data[[classification]], levels = c('spike', rev(unique(graph_data[[classification]][!(graph_data[[classification]]=='spike')])))))
setkey(graph_data, "Gene", "Sample")

setnames(SC_I, c("ARG", "ARG_Family"), c("Family", "Class"))
graph_data <- rbindlist(list(
  cbind(graph_data[,c('Sample', 'Class', 'Family', 'Matrix', 'V1')], Tech = 'DARTE-QM'),
  cbind(SC_I[,c('Sample', 'Family', 'Class', 'Matrix', 'V1')], Tech = 'Metagenome')), fill = TRUE)
graph_data[, relative_abundance := round(V1/sum(V1), 4), by = c('Sample')]
set(graph_data, j = 'Matrix', value = as.character(graph_data$Matrix))
set(graph_data, which(graph_data$Matrix == "manure"), 'Matrix', "Swine Manure-A")
set(graph_data, which(graph_data$Matrix == "effluent"), 'Matrix', "Effluent")
set(graph_data, which(graph_data$Matrix == "Manure-Soil A"), 'Matrix', "Soil-A + Manure-A")

graph_data <- graph_data[!(is.na(relative_abundance))]
graph_data <- graph_data[graph_data$Matrix != 'Effluent',]
graph_data <- graph_data[V1 != 0]
graph_data[, relative_abundance := round(V1/sum(V1), 4), by = c('Sample')]

classification_order <- setorder(graph_data[, lapply(.SD, sum, na.rm=TRUE), by=Class, .SDcols=c("relative_abundance")], -relative_abundance)
classification_order <- classification_order[round(classification_order[[2]]*100 / length(unique(graph_data[Tech == "DARTE-QM"]$Sample)),1) >= 0.5,]

graph_data <- graph_data[Class %in% classification_order$Class]
set(graph_data, j = 'Class', value = factor(graph_data$Class, levels = classification_order[[1]]))

missing <- unique(sort(as.character(graph_data[Tech != "DARTE-QM"]$Class[!(graph_data[Tech != "DARTE-QM"]$Class %in% graph_data[Tech == "DARTE-QM"]$Class)])))
setorder(graph_data, 'Class')
genes <- as.character(graph_data$Class)
for(i in seq_along(missing)){
  genes[genes %in% missing[i]] <- c("mex", "mux", "noc", "oxa")[i]
}
set(graph_data, j = 'Class', value = factor(genes, levels = unique(genes)))
setkey(graph_data, 'Sample')
set(graph_data, j = 'Matrix', value = factor(graph_data$Matrix, levels = unique(metadata$Matrix)))

graph_data <- graph_data[, lapply(.SD, sum, na.rm=TRUE), by=c('Sample', "Family", "Class", 'Matrix', 'Tech'),
                         .SDcols=c("V1", "relative_abundance") ]
graph_data[, relative_abundance := round(V1/sum(V1), 4), by = c('Sample')]
graph_colors <- schuylR::create_palette(length(unique(graph_data[['Class']])))

gene_classes <- sort(unique(graph_data[['Class']]))
compare_data <- graph_data[c(grep('Swine Manure-A', graph_data$Sample), grep('Soil-A', graph_data$Sample), grep('_L0', graph_data$Sample)), ]
compare_data <- compare_data[Matrix %in% c('Swine Manure-A', 'Soil-A + Manure-A')]

set(compare_data, j = 'Sample', value = factor(compare_data[['Sample']], levels = unique(graph_data[['Sample']])))
set(compare_data, j = 'Matrix', value = factor(compare_data[['Matrix']], levels = unique(graph_data[['Matrix']])))

profile_compare <- ggplot(compare_data,
       aes_string(x = "Sample",
                  y = "relative_abundance",
                  fill = "Class")) +
  guides(fill = guide_legend(ncol = 2)) +
  scale_fill_manual(
    values = graph_colors[gene_classes[gene_classes %in% unique(compare_data[['Class']])]],
    aesthetics = c("color", "fill")
  ) +
  facet_nested(.~ Tech + Matrix, scales = "free", space = "free") +
  geom_bar(stat = "identity", position = "stack",
           size = 0.001, width = 0.95, color = 'black') +
  ylab("Relative Abundance") +
  theme_bw() +
  theme(axis.text.x = element_text(size= 12, angle = 330, hjust = -0.05),
         axis.text.y = element_blank(),
         axis.title.x = element_blank(),
         axis.title.y = element_text(size = 12, face = "bold"),
         axis.ticks.x = element_blank(),
         legend.title = element_text(size = 12, face = "bold"),
         legend.text = element_text(size = 12),
         legend.spacing.x = unit(0.005, "npc"),
         legend.key.size = unit(6, "mm"),
         panel.background = element_rect(color = "black", size = 1.5),
         panel.spacing = unit(0.01, "npc"),
         strip.text.x = element_text(size = 10, face = "bold"),
         strip.background = element_rect(colour = "black", size = 1.4, fill = "white"),
         panel.grid.major.x = element_blank()) +
  scale_y_continuous(expand = expansion(mult = c(0.0037, 0.003), add = c(0, 0))) +
  scale_x_discrete(expand = expansion(mult = 0, add = 0.51))
Diversity
alpha <- compare_data
alpha <- dcast(alpha, Class ~ Sample, value.var = 'relative_abundance', fun.aggregate = sum)
alpha <- alpha[rowSums(alpha[,-1]) > 0 ,-1]
replace_DT_NA(alpha)

alpha <- alpha[,lapply(.SD,function(sample) sample/sum(sample))]
alpha <- -alpha * log(alpha)
alpha <- alpha[,lapply(.SD, sum, na.rm = TRUE)]

samples <- dcast(compare_data, Sample + Tech + Matrix ~ Class,
                 value.var = 'relative_abundance', fun.aggregate = sum)

alpha_data <- data.table(Sample = samples$Sample,
    Matrix = samples$Matrix,
    Tech = samples$Tech,
    Alpha = unlist(alpha))
color_count <- length(unique(paste(alpha_data$Tech, alpha_data$Matrix)))
alpha_graph_colors <- schuylR::create_palette(color_count)

div_graph <- ggplot(alpha_data, aes(Matrix, Alpha)) +
    geom_boxplot(show.legend = FALSE, fill = alpha_graph_colors) +
    theme_bw() +
  theme(
    axis.text.x = element_text(size = 12, face = "bold"),
    axis.text.y = element_text(hjust = 0.95, size = 12),
    axis.title.x = element_blank(),
    axis.title.y = element_text(size = 12, face = "bold"),
    axis.ticks.x = element_blank(),
    strip.text.x = element_text(size = 12, face = "bold"),
    strip.background = element_rect(colour = "black", size = 1.4, fill = "white"),
    panel.grid.major.x = element_blank()) +
    labs(y = paste("Alpha-Diverity (Shannon Index)", sep = "")) +
    facet_nested(.~ Tech, scales = "free", space = "free")
Resitome Differences
Swine Manure-A
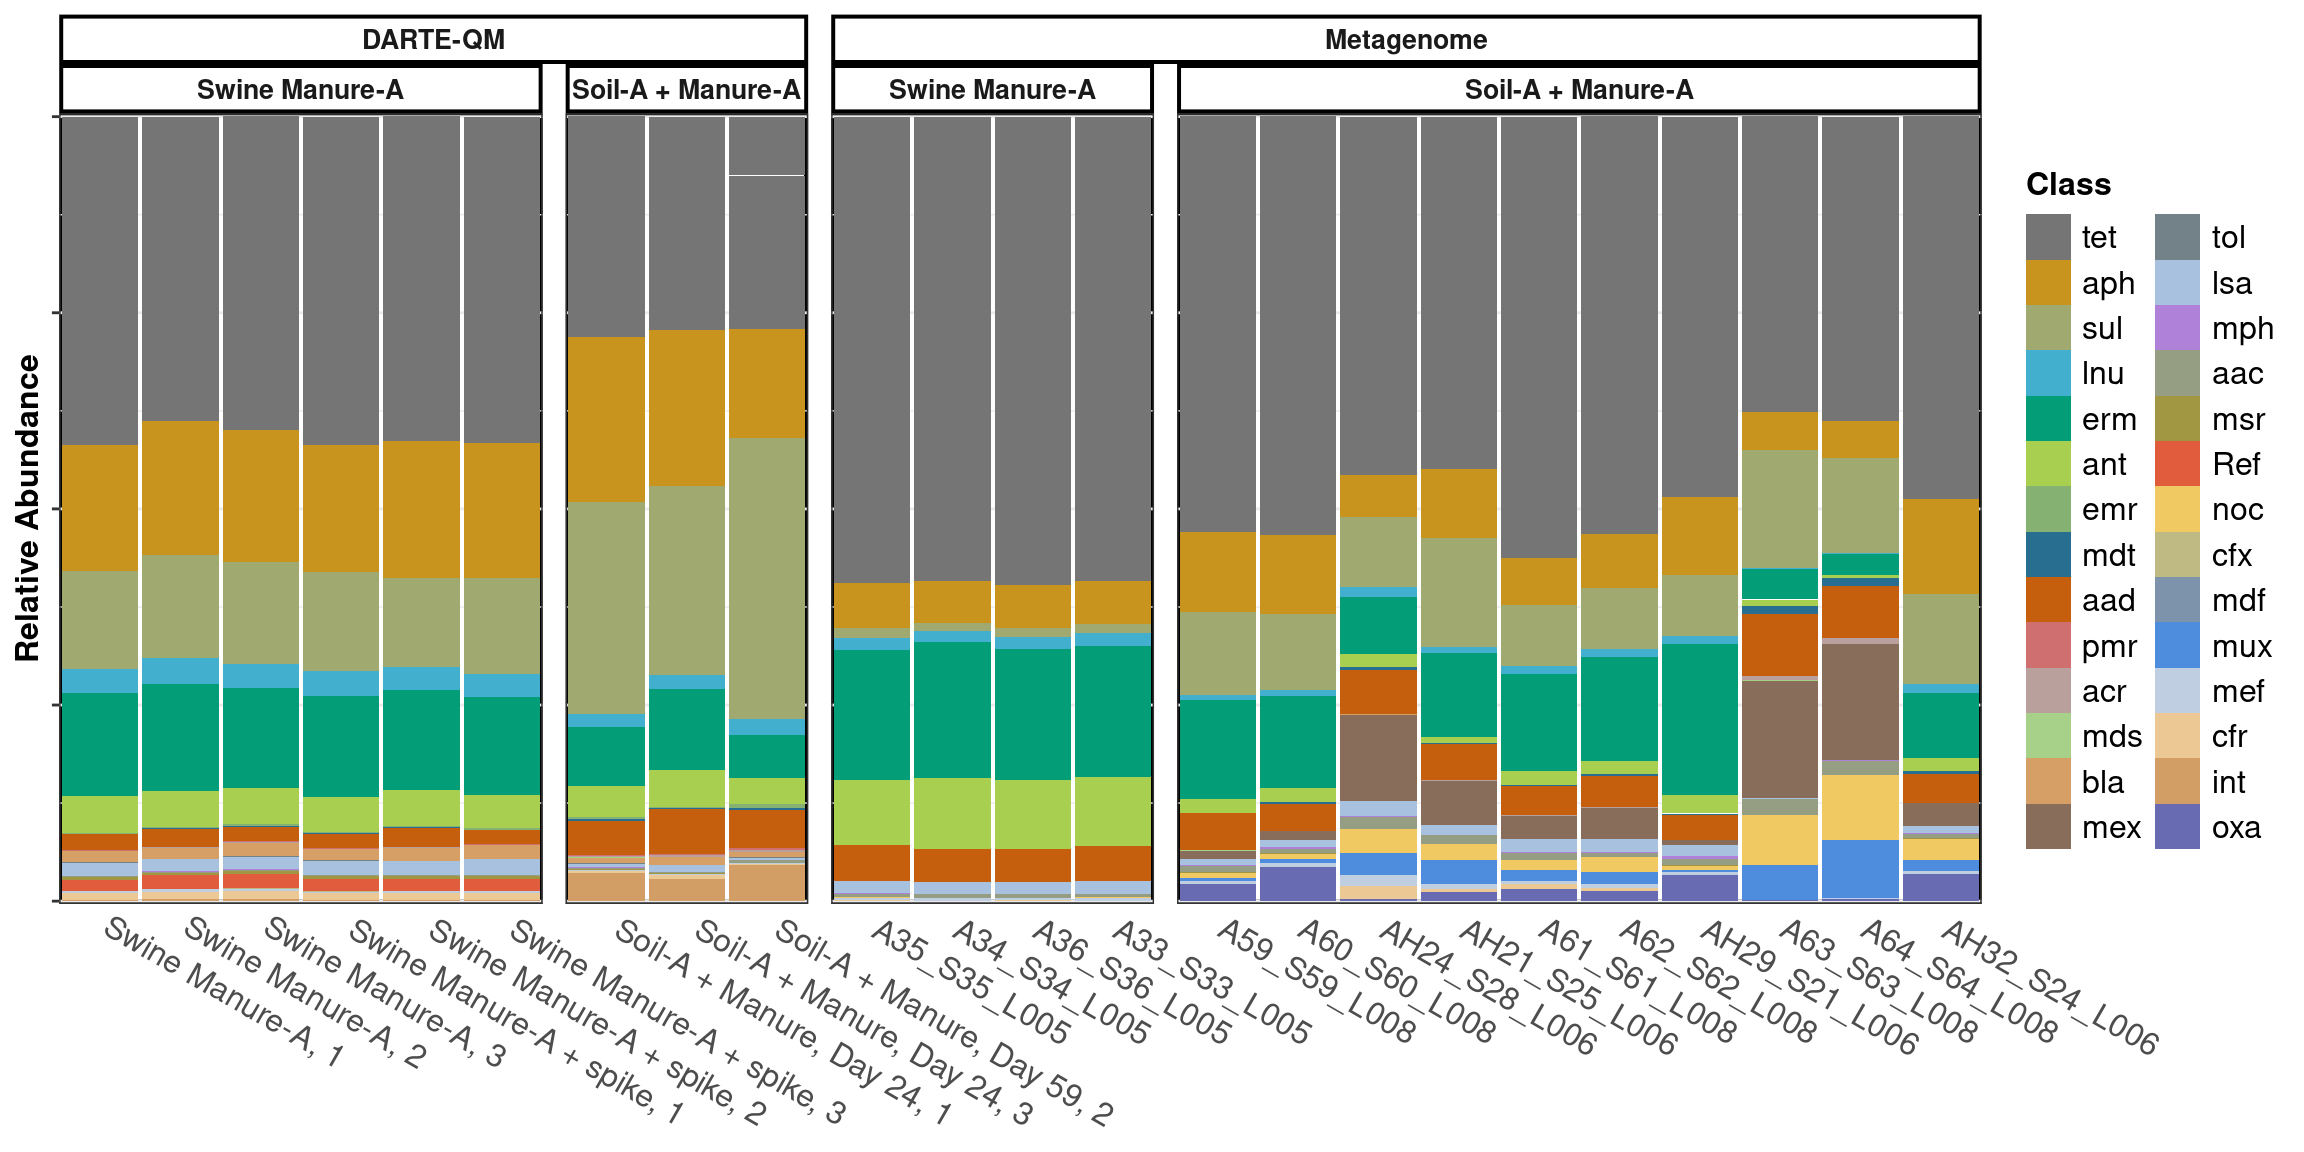
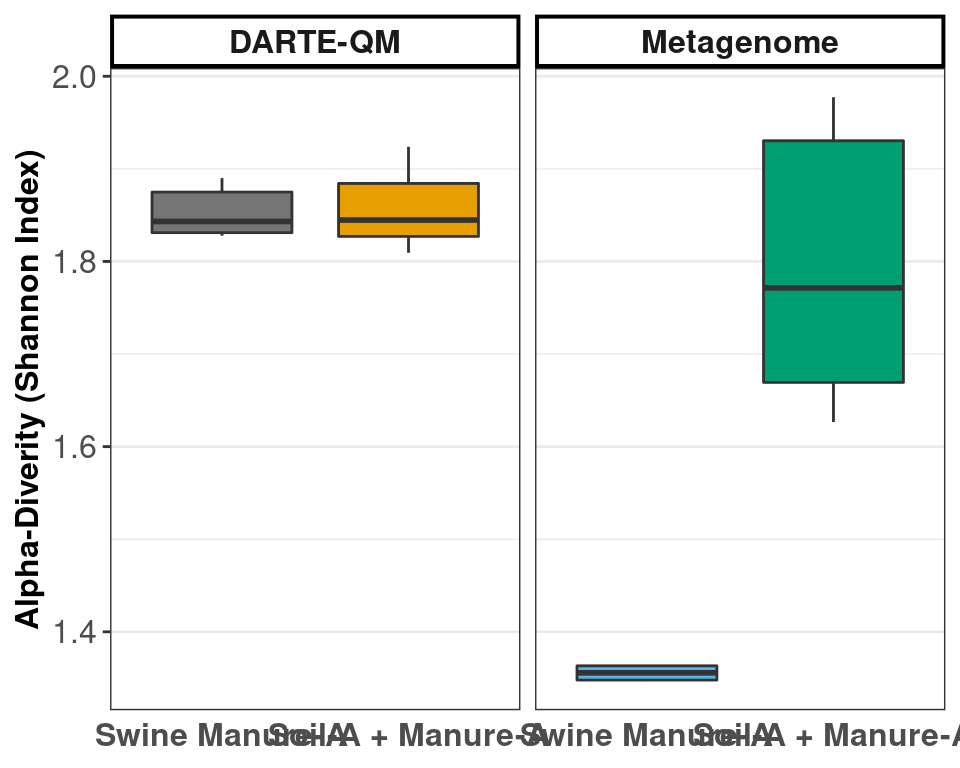
DARTE-QM had 99 ARGs in Swine Manure-A samples, with an alpha-diversity measured at 1.85.
compared to metagenomes which had 56 ARGs in Swine Manure-A samples, with an alpha-diversity measured at 1.36.
The metagenome found 39 ARGs that were not detected with DARTE-QM.
The mean BC = 0.12 for ARG Families in Swine Manure-A Samples between both technologies.
Manure-Soil
DARTE-QM had 99 ARGs in Manure-Soil samples, with an alpha-diversity measured at 1.86.
compared to metagenomes which had 92 ARGs in Swine Manure-A samples, with an alpha-diversity measured at 1.79.
The metagenome found 50 ARGs that were not detected with DARTE-QM.
The mean BC = 0.32 for ARG Families in Manure + Soil-A Samples between both technologies.
Source Differentiation
darte_manure <- dcast(compare_data[Tech == "DARTE-QM"][Matrix == "Swine Manure-A"], Tech ~ Class, value.var = 'relative_abundance', fun.aggregate = mean)
darte_soil_manure <- dcast(compare_data[Tech == "DARTE-QM"][Matrix != "Swine Manure-A"], Tech ~ Class, value.var = 'relative_abundance', fun.aggregate = mean)

meta_manure <- dcast(compare_data[Tech != "DARTE-QM"][Matrix == "Swine Manure-A"], Tech ~ Class, value.var = 'relative_abundance', fun.aggregate = mean)
meta_soil_manure <- dcast(compare_data[Tech != "DARTE-QM"][Matrix != "Swine Manure-A"], Tech ~ Class, value.var = 'relative_abundance', fun.aggregate = mean)
For ARGs characterized by DARTE-QM, the mean distance between manure and soil-manure samples was BC = 0.37.
For ARGs characterized by metagenomes, the mean distance between manure and soil-manure samples was BC = 0.46.
DARTE-QM Target ARGs
Profiles
compare_data <- compare_data[Family %in% classifications$Family]
compare_data[, relative_abundance := round(V1/sum(V1), 4), by = c('Sample')]

profile_compare <- ggplot(compare_data,
       aes_string(x = "Sample",
                  y = "relative_abundance",
                  fill = "Class")) +
  guides(fill = guide_legend(ncol = 2)) +
  scale_fill_manual(
    values = graph_colors[gene_classes[gene_classes %in% unique(compare_data[['Class']])]],
    aesthetics = c("color", "fill")
  ) +
  facet_nested(.~ Tech + Matrix, scales = "free", space = "free") +
  geom_bar(stat = "identity", position = "stack",
           size = 0.005, width = 0.95, color = 'black') +
  ylab("Relative Abundance") +
  theme_bw() +
  theme(axis.text.x = element_text(size= 12, angle = 330, hjust = -0.05),
         axis.text.y = element_blank(),
         axis.title.x = element_blank(),
         axis.title.y = element_text(size = 12, face = "bold"),
         axis.ticks.x = element_blank(),
         legend.title = element_text(size = 12, face = "bold"),
         legend.text = element_text(size = 12),
         legend.spacing.x = unit(0.005, "npc"),
         legend.key.size = unit(6, "mm"),
         panel.background = element_rect(color = "black", size = 1.5),
         panel.spacing = unit(0.01, "npc"),
         strip.text.x = element_text(size = 10, face = "bold"),
         strip.background = element_rect(colour = "black", size = 1.4, fill = "white"),
         panel.grid.major.x = element_blank()) +
  scale_y_continuous(expand = expansion(mult = c(0.0037, 0.003), add = c(0, 0))) +
  scale_x_discrete(expand = expansion(mult = 0, add = 0.51))
Diversity
alpha <- compare_data
alpha <- dcast(alpha, Family ~ Sample, value.var = 'relative_abundance', fun.aggregate = sum)
alpha <- alpha[,-1]
replace_DT_NA(alpha)

alpha <- alpha[,lapply(.SD,function(sample) sample/sum(sample))]
alpha <- -alpha * log(alpha)
alpha <- alpha[,lapply(.SD, sum, na.rm = TRUE)]

samples <- dcast(compare_data, Sample + Tech + Matrix ~ Family, value.var = 'relative_abundance')

alpha_data <- data.table(Sample = samples$Sample,
    Matrix = samples$Matrix,
    Tech = samples$Tech,
    Alpha = unlist(alpha))
  color_count <- length(unique(paste(alpha_data$Tech, alpha_data$Matrix)))
  graph_colors <- create_palette(color_count)

div_graph <- ggplot(alpha_data, aes(Matrix, Alpha)) +
    geom_boxplot(show.legend = FALSE, fill = graph_colors) +
    theme_bw() +
  theme(
    axis.text.x = element_text(size = 12, face = "bold"),
    axis.text.y = element_text(hjust = 0.95, size = 12),
    axis.title.x = element_blank(),
    axis.title.y = element_text(size = 12, face = "bold"),
    axis.ticks.x = element_blank(),
    strip.text.x = element_text(size = 12, face = "bold"),
    strip.background = element_rect(colour = "black", size = 1.4, fill = "white"),
    panel.grid.major.x = element_blank()) +
    labs(y = paste("Alpha-Diverity (Shannom Index)", sep = "")) +
    facet_nested(.~ Tech, scales = "free", space = "free")  +
  scale_y_continuous(breaks = seq(2, 4, 0.2), limits = c(2,4))
Resitome Differences
Swine Manure-A
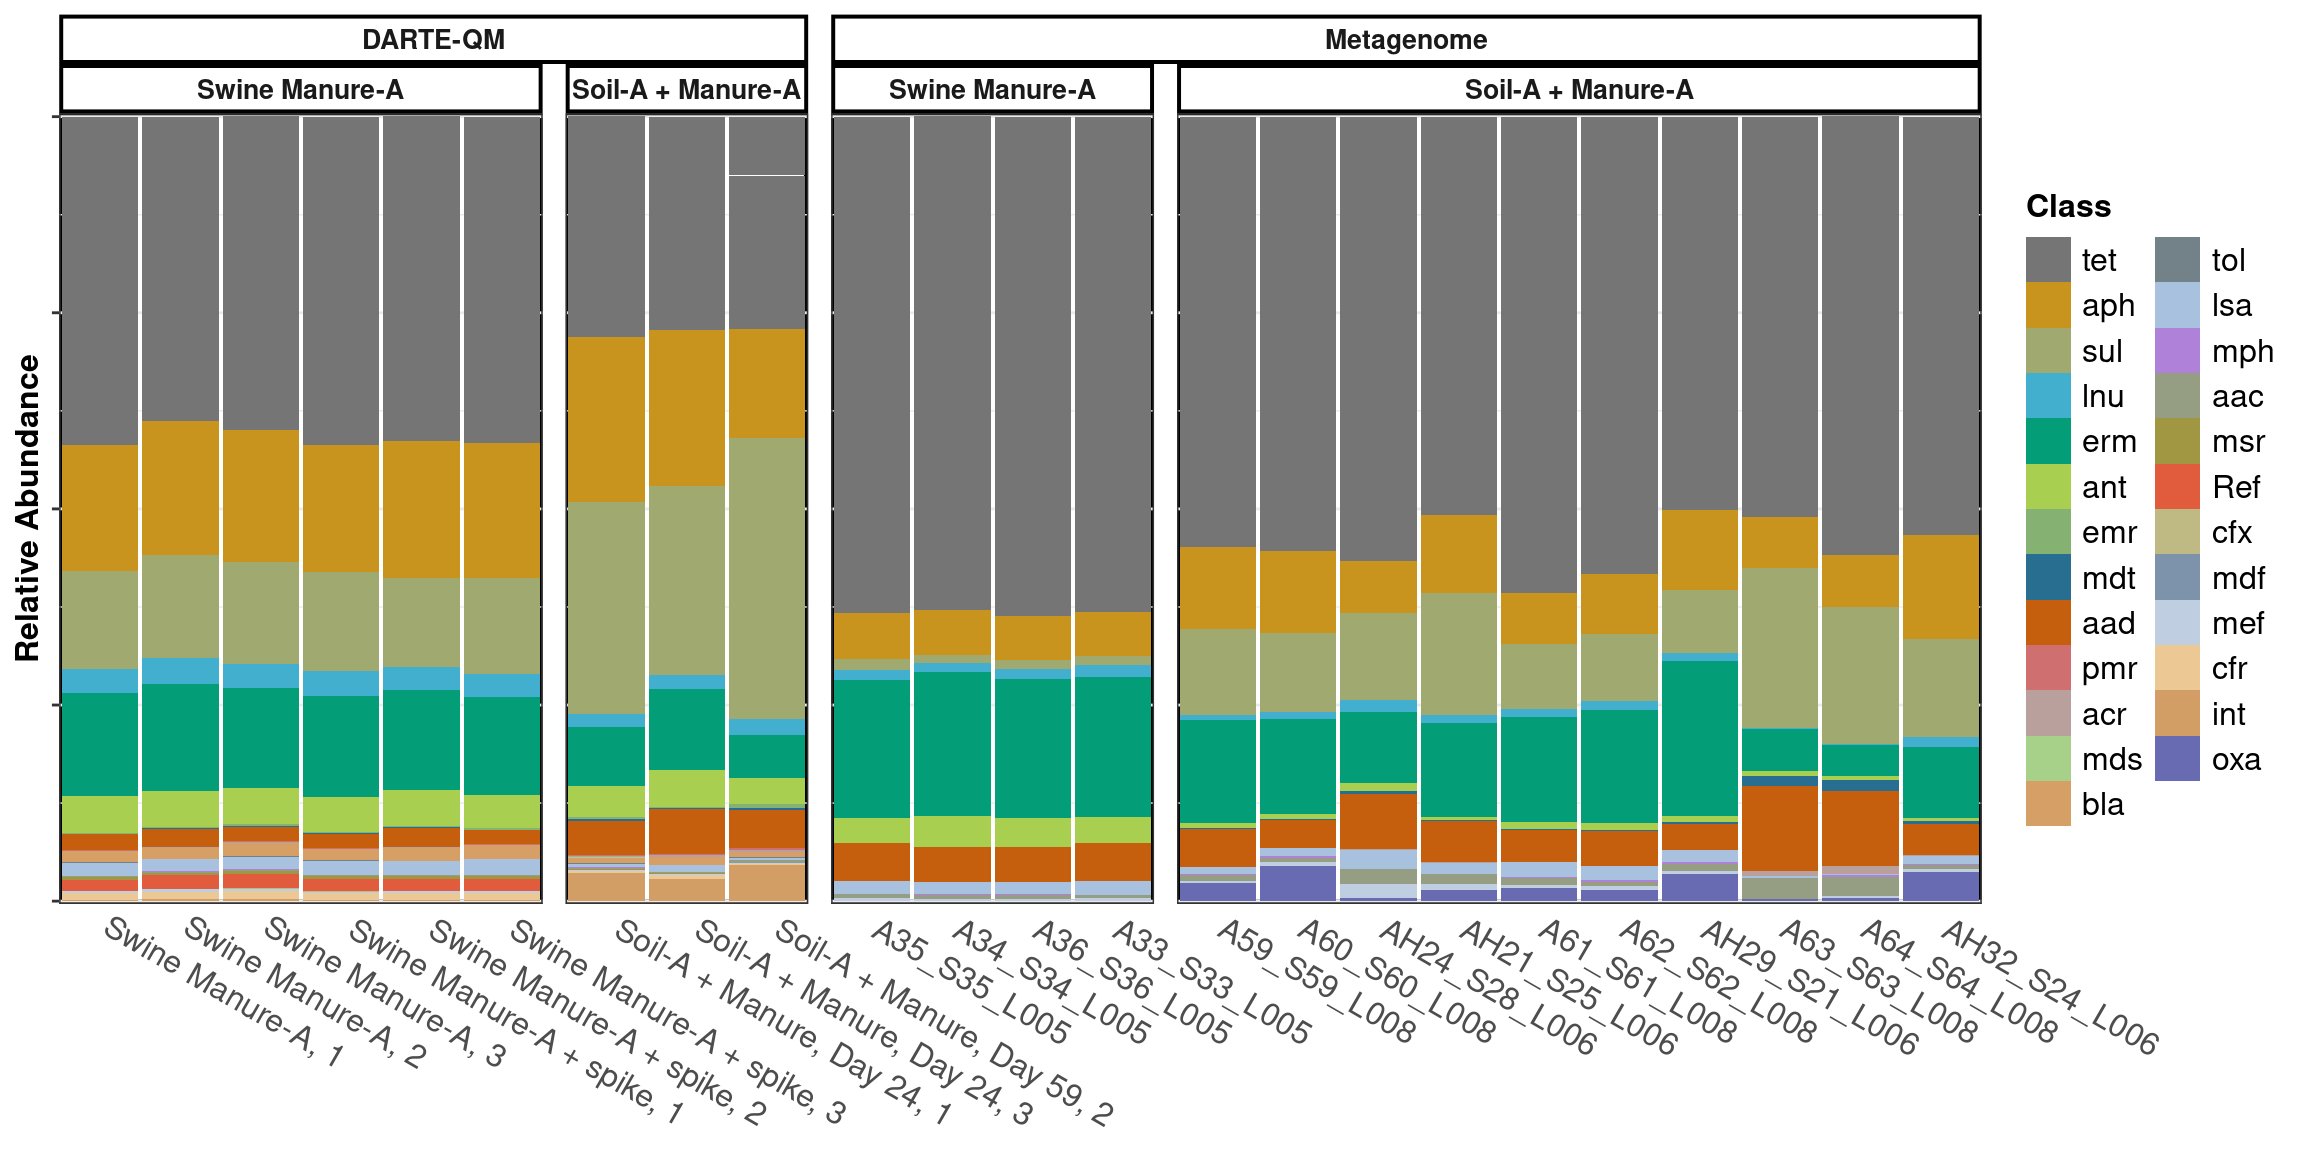
With the ARGs filtered to only include those targeted by DARTE-QM, metagenomes found 49 of the 99 that DARTE-QM found, with an alpha diversity of 2.92. The metagenome technology was able to find 9 ARGs targeted by DARTE-QM that the DARTE-QM primers were unable to successfully capture.
Manunre-Soil
With the ARGs filtered to only include those targeted by DARTE-QM, metagenomes found 65 of the 99, with an alpha diversity of 2.89. The metagenome technology was able to find 15 ARGs targeted by DARTE-QM that the DARTE-QM primers were unable to successfully capture.
Source Differentiation for DARTE-QM Targets
darte_manure <- dcast(compare_data[Tech == "DARTE-QM"][Matrix == "Swine Manure-A"], Tech ~ Class, value.var = 'relative_abundance', fun.aggregate = mean)
darte_soil_manure <- dcast(compare_data[Tech == "DARTE-QM"][Matrix != "Swine Manure-A"], Tech ~ Class, value.var = 'relative_abundance', fun.aggregate = mean)

meta_manure <- dcast(compare_data[Tech != "DARTE-QM"][Matrix == "Swine Manure-A"], Tech ~ Class, value.var = 'relative_abundance', fun.aggregate = mean)
meta_soil_manure <- dcast(compare_data[Tech != "DARTE-QM"][Matrix != "Swine Manure-A"], Tech ~ Class, value.var = 'relative_abundance', fun.aggregate = mean)
For ARGs characterized by DARTE-QM, the mean distance between manure and soil-manure samples was BC = 0.37.
For ARGs characterized by metagenomes, the mean distance between manure and soil-manure samples was BC = 0.37.
Schuyler Smith
Ph.D. Student - Bioinformatics and Computational Biology
Iowa State University. Ames, IA.